Author: admin

  • Boost Your SAT Score Now

    Boost Your SAT Score Now

    Surprising Truth

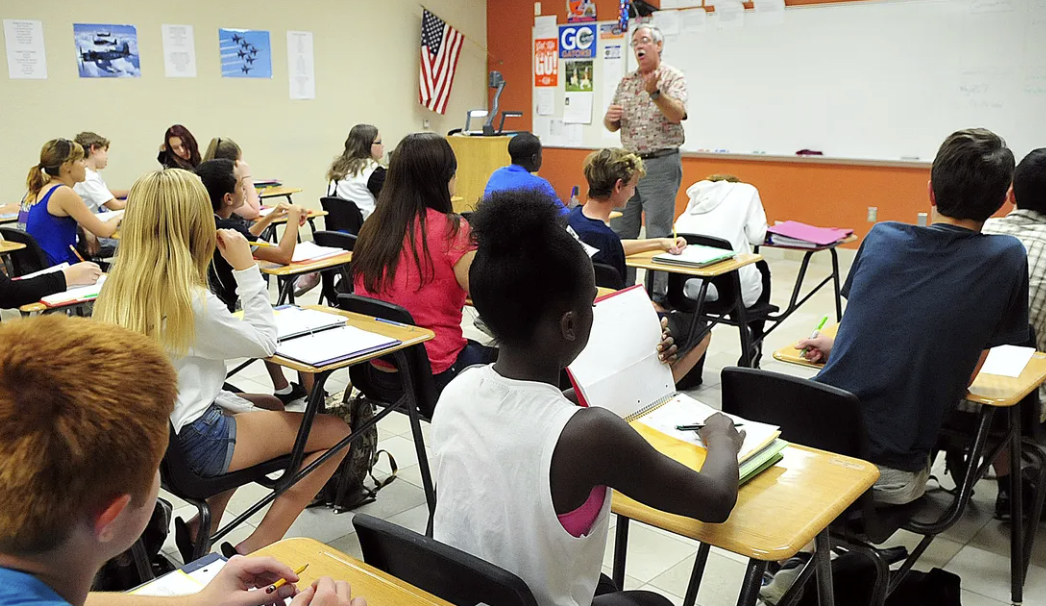
    Most students in Portland, Beaverton, and Hillsboro think they need to be a genius to get a high SAT score, you know, but honestly, it’s not about being a genius, it’s about having a solid strategy. Meet Emily, a senior at a high school in Bethany, she was struggling to get a decent score, her parents were worried, her teachers were worried, but Emily was determined to improve. She spent hours studying, but her score wasn’t budging, that was until she changed her approach.

    So, what was holding Emily back? It was her lack of understanding of the test format, and her inability to manage her time effectively. She would often run out of time, or misread questions, and that would throw her off. But, once she figured out the format, and learned how to manage her time, her score started to rise. You can do the same, by understanding the test format, and learning how to manage your time, you’ll be amazed at how much your score can improve.

    Breaking It Down

    Let’s break it down, the SAT is a long test, it’s over three hours, and it’s exhausting, but if you’re prepared, you’ll be fine. The test is divided into four sections, reading, writing, math, and an optional essay, each section has its own unique challenges, but with the right strategy, you can conquer them. For example, in the reading section, you need to be able to read quickly, and understand complex texts, in the math section, you need to be able to solve problems quickly, and accurately.

    You can improve your SAT score, by focusing on your weaknesses, and building on your strengths. If you’re struggling with math, don’t worry, you can improve, with practice, and patience. If you’re struggling with reading, don’t worry, you can improve, by reading more, and practicing your comprehension skills. The key is to identify your weaknesses, and work on them, you know, it’s like training for a sport, you need to practice, to get better.

    SAT Score Improvement Tips

    So, here are some tips, to help you improve your SAT score, first, practice consistently, don’t cram, it doesn’t work. Second, use authentic materials, the College Board website has plenty of free resources, use them. Third, join a test prep course, or get a tutor, it can make a big difference, honestly. At MMT Prep, our tutoring center in Beaverton, we offer test prep courses, and one-on-one tutoring, our experienced instructors, can help you improve your SAT score, and get into your dream college.

    In Portland, Oregon, we have a lot of resources, to help you prepare, from tutoring centers, to online courses, you can find what works best for you. In Beaverton, OR, we have MMT Prep, which offers SAT tutoring, and test prep courses, that can help you raise your SAT score, and get into a top college. So, don’t wait, start preparing, today, you can do it, you know. Raising SAT scores in Beaverton, is our specialty, at MMT Prep, we have the expertise, and the experience, to help you succeed.

    Call to Action

    So, what are you waiting for, contact MMT Prep, today, and let us help you improve your SAT score, our experienced instructors, can help you develop a personalized plan, to achieve your goals. Don’t let your SAT score hold you back, take control, and get the score you deserve. At MMT Prep, we believe in you, and we know, you can do it. Visit our website, or give us a call, to learn more, about our SAT test prep strategies, and Oregon SAT preparation courses, you won’t regret it.

  • Class of 2030 Admit Rates: Latest College Acceptance Rate Trends

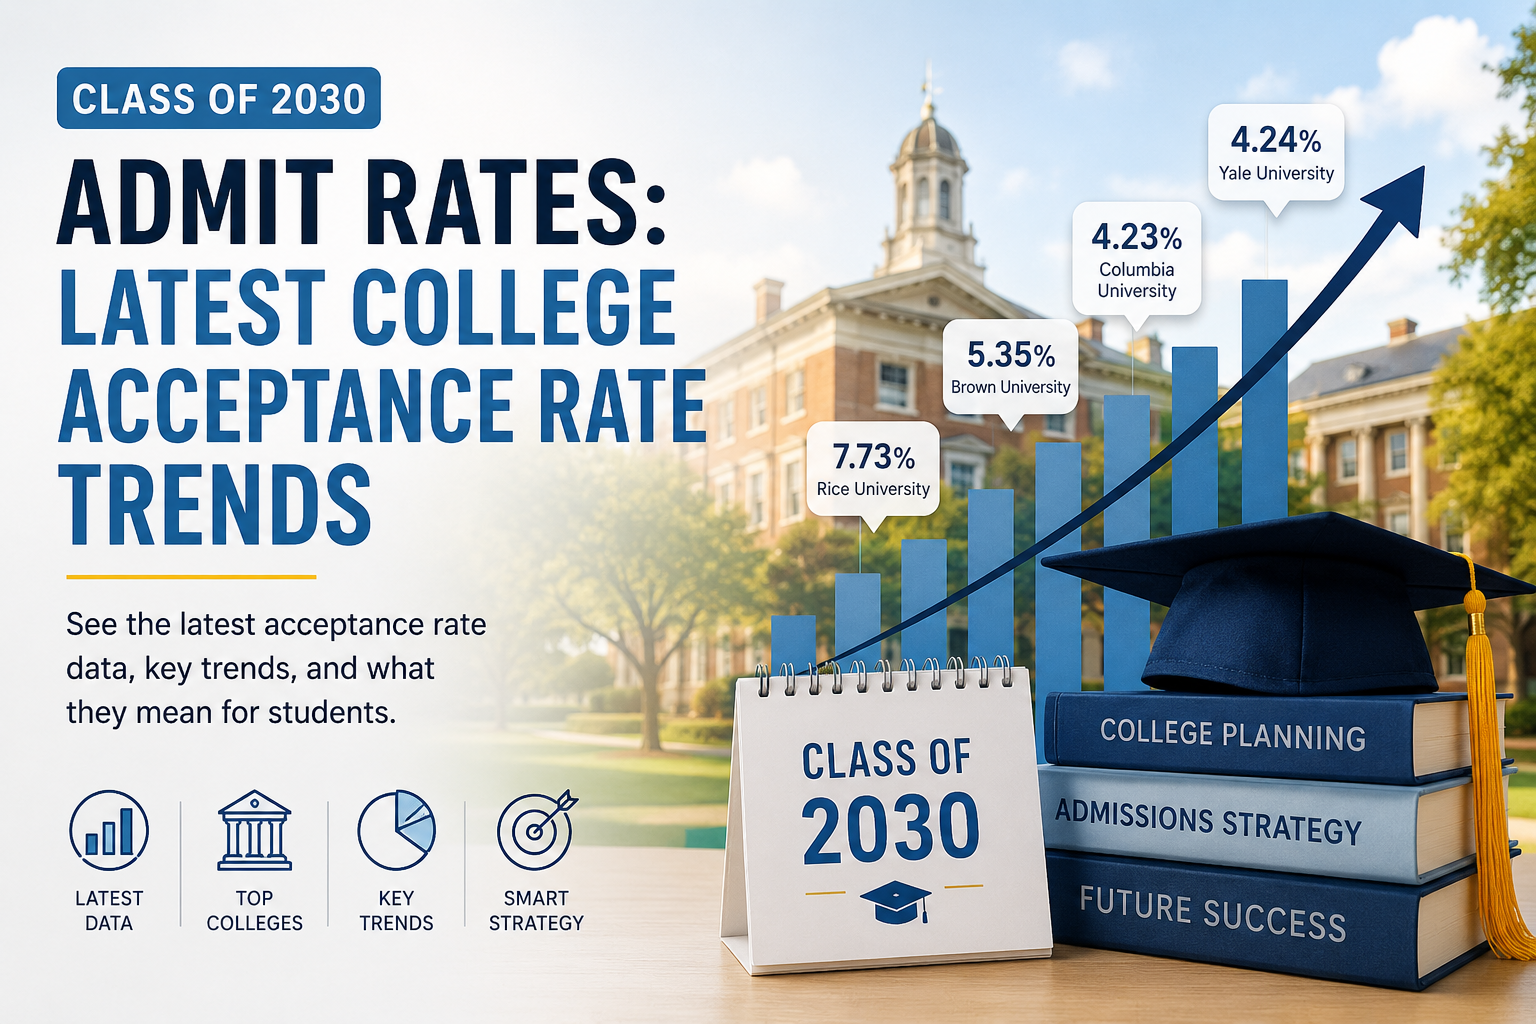
    Class of 2030 Admit Rates: Latest College Acceptance Rate Trends

    Class of 2030 Admit Rates

    Overall admission rates for the class of 2030 are updated once information become available. Check back for updates as colleges continue to release data!

    School Class of 2030 Class of 2029 Class of 2028 Class of 2027
    Adelphi University TBA 72.15% 65.90% 77.53%
    American University TBA 65.56% 61.87% 47.38%
    Amherst College 6.78% 7.72% 9.01% 9.81%
    Arizona State University TBA Overall: 88.39%
    In-state: 90.00%
    Out-of-state: 87.24%
    International: 89.93%
    Overall: 89.89%
    In-state: 91.62%
    Out-of-state: 89.17%
    International: 89.63%
    Overall: 90.19%
    In-state: 92.00%
    Out-of-state: 89.74%
    International: 88.38%
    Auburn University TBA 46.89% 45.92% 50.47%
    Babson College TBA 16.00% 17.09% 19.74%
    Barnard College TBA 10.05% 8.84% 7.96%
    Bates College TBA 14.83% 13.30% 13.06%
    Baylor University TBA 52.22% 51.28% 50.97%
    Belmont University TBA 93.67% 95.28% 96.36%
    Bentley University TBA TBA 45.05% 48.44%.pdf)
    Binghamton University TBA Overall: 37.31%
    In-state: 29.10%
    Out-of-state: 73.73%
    International: 62.06%
    Overall: 38.61%
    In-state: 31.32%
    Out-of-state: 79.18%
    International: 65.44%
    Overall: 37.73%
    In-state: 31.45%
    Out-of-state: 75.16%
    International: 60.98%
    Boston College 12.70% 13.85% 16.19% 15.65%
    Boston University TBA 12.83% 11.11% 10.85%
    Bowdoin College 6.53% 6.81% 7.13% 8.02%
    Brandeis University TBA 45.00% 40.47% 35.33%
    Brown University 5.35% 5.65% 5.39% 5.23%
    Bryn Mawr College TBA 28.15% 29.43% 31.06%
    Bucknell University TBA 32.20% 28.93% 32.01%
    California Institute of Technology TBA 3.78% 2.57% 3.14%
    California Polytechnic State University, San Luis Obispo TBA Overall: 29.96%
    In-state: 26.36%
    Out-of-state: 62.08%
    International: 31.03%
    Overall: 31.22%
    In-state: 28.85%
    Out-of-state: 53.56%
    International: 30.83%
    Overall: 29.65%
    In-state: 28.24%
    Out-of-state: 41.43%
    International: 34.69%
    Carleton College TBA 21.78% 20.41% 22.28%
    Carnegie Mellon University TBA 11.07% 11.66% 11.40%
    Case Western Reserve University TBA 35.31% 37.78% 28.68%
    Chapman University TBA 72.06% 65.43% 55.61%
    Claremont McKenna College TBA 9.44% 9.59% 11.12%
    Clark University TBA 40.47% 39.54% 41.67%
    Clemson University TBA Overall: 42.43%
    In-state: 52.89%
    Out-of-state and international: 40.36%
    Overall: 38.34%
    In-state: 55.95%
    Out-of-state: 34.94%
    International: 35.77%
    Overall: 38.05%
    In-state: 49.23%
    Out-of-state: 36.04%
    International: 19.64%
    Colby College TBA 8.00% 7.09% 6.83%
    Colgate University TBA 17.43% 13.88% 11.95%
    College of Charleston TBA Overall: 73.00%
    In-state: 72.52%
    Out-of-state: 73.53%
    International: 47.68%
    Overall: 60.03%
    In-state: 73.94%
    Out-of-state: 55.76%
    International: 54.44%
    Overall: 72.00%
    In-state: 75.61%
    Out-of-state: 70.92%
    International: 49.06%
    College of the Holy Cross TBA 17.00% 18.00% 21.10%
    Colorado College TBA 22.09% 18.47% 20.03%
    Columbia University 4.23% 4.94% 3.86% 4.00%
    Connecticut College TBA 39.18% 37.04% 38.28%
    Cornell University TBA 8.38% 8.41% 7.90%
    Dartmouth College 5.84% 6.02% 5.40% 6.23%
    Davidson College TBA 12.62% 13.37% 14.48%
    Denison University ~22.00% 19.55% 17.39% 16.93%
    DePaul University TBA 87.80% 75.89% 73.53%
    Dickinson College TBA 41.49% 42.09% 43.08%
    Drexel University TBA 69.90% 79.44% 77.53%
    Duke University 4.73% 5.20% 5.71% 6.78%
    Elon University TBA 63.26% 66.35% 67.31%
    Emory University Overall: 12.29% Emory: 10.30%
    Oxford: 13.34%
    Emory: 10.29%
    Oxford: 12.66%
    Emory: 10.65%
    Oxford: 16.51%
    Fairfield University 21.00% 25.05% 33.29% 44.98%
    Fashion Institute of Technology TBA Overall: 67.01%
    In-state: 69.60%
    Out-of-state: 65.08%
    International: 64.38%
    Overall: 60.24%
    In-state: 65.52%
    Out-of-state: 57.48%
    International: 51.88%
    Overall: 57.61%
    In-state: 59.59%
    Out-of-state: 56.97%
    International: 53.61%
    Florida State University Overall: ~20.11% Overall: 23.83%
    In-state: 34.05%
    Out-of-state: 13.53%
    International: 7.88%
    Overall: 24.22%
    In-state: 31.85%
    Out-of-state: 16.58%
    International: 10.55%
    Overall: 25.38%
    In-state: 36.14%
    Out-of-state: 14.42%
    International: 8.09%
    Fordham University ~47.00% 57.76% 59.29% 56.28%
    Franklin & Marshall College TBA 31.63% 28.19% 31.83%
    Furman University TBA 47.98% 42.95% 52.57%
    George Washington University TBA TBA 47.09% 43.54%
    Georgetown University 13.00% 13.49% 12.91% 13.08%
    Georgia Tech Overall: 12.82%
    In-state: ~27.64%
    Out-of-state and international: ~9.28%
    Overall: 13.34%
    In-state: 29.46%
    Out-of-state: 10.12%
    International: 7.34%
    Overall: 14.07%
    In-state: 33.13%
    Out-of-state: 10.42%
    International: 8.20%
    Overall: 16.46%
    In-state: 36.60%
    Out-of-state: 12.53%
    International: 9.95%
    Gonzaga University TBA 79.62% 81.69% 75.96%
    Grinnell College TBA 16.00% 14.51% 12.68%
    Hamilton College TBA 13.59% 13.62% 11.77%
    Harvard University TBA 4.18% 3.65% 3.45%
    Harvey Mudd College TBA 12.33% 12.66% 13.10%
    Haverford College TBA 13.31% 12.37% 12.91%
    Howard University TBA TBA 41.34% 34.89%
    Hunter College TBA TBA 53.80% 54.05%
    Indiana University – Bloomington TBA Overall: 75.89%
    In-state: 72.24%
    Out-of-state: 78.58%
    International: 63.61%
    Overall: 78.21%
    In-state: 75.14%
    Out-of-state: 80.76%
    International: 66.82%
    Overall: 80.37%
    In-state: 75.79%
    Out-of-state: 83.91%
    International: 70.64%
    Johns Hopkins University TBA 6.11% 6.44% 7.56%
    Kenyon College TBA TBA 31.03% 30.71%
    Lafayette College 32.27% 31.16% 31.45% 31.40%
    Lehigh University TBA 28.96% 25.93% 29.26%
    Lewis & Clark College TBA 71.18% 78.49% 74.53%
    Loyola Marymount University TBA 48.21% 45.08% 40.29%
    Loyola University Chicago TBA 75.10% 81.60% 81.39%
    Loyola University Maryland TBA 69.86% 75.49% 76.33%
    Macalester College TBA 28.13% 28.52% 28.21%
    Marquette University TBA 78.02% 81.34% 87.48%
    Massachusetts Institute of Technology 4.58% 4.56% 4.55% 4.80%
    Miami University – Ohio TBA 70.41% Overall: 75.40%
    In-state: 80.42%
    Out-of-state: 83.49%
    International: 33.98%
    83.35%
    Michigan State University TBA 81.27% Overall: 84.80%
    In-state: 84.36%
    Out-of-state: 84.37%
    International: 88.10%
    87.05%
    Middlebury College Fall 2026 and spring 2027 admits: ~17.00% Fall 2025 admits only: 12.77%
    Fall 2025 and spring 2026 admits: ~13.90%
    Fall 2024 admits only: 10.75%
    Fall 2024 and spring 2025 admits: 11.96%
    Fall 2023 admits only: 10.37%
    Fall 2023 and spring 2024 admits: ~11.00%
    Montana State University TBA Overall: 99.38% Overall: 82.14%
    In-state: 86.21%
    Out-of-state: 80.99%
    International: 91.78%
    Overall: 86.83%
    In-state: 84.93%
    Out-of-state: 87.29%
    International: 98.67%
    Mount Holyoke College TBA TBA 36.00% 38.00%
    Muhlenberg College TBA TBA 71.99% 64.01%
    New York University TBA 9.06%%20for%20the%20web.pdf) 9.23% 9.41%
    North Carolina State University TBA Overall: 39.53%
    In-state: 46.22%
    Out-of-state: 25.17%
    International: 34.36%
    Overall: 41.67%
    In-state: 49.56%
    Out-of-state: 35.71%
    International: 22.87%
    Overall: 39.55%
    In-state: 49.98%
    Out-of-state: 28.67%
    International: 28.45%
    Northeastern University TBA 5.62% 5.22% 5.65%
    Northwestern University ~7.00% ~7.00% 7.69% 7.22%
    Oberlin College TBA College of Arts and Sciences: 34.02%
    Conservatory of Music: 26.11%
    Overall: 34.16%
    College of Arts and Sciences: 34.30%
    Conservatory of Music: 33.09%
    Overall: 32.98%
    College of Arts and Sciences: 32.92%
    Conservatory of Music: 34.68%
    Occidental College TBA 44.85% 44.17% 39.89%
    Ohio State University TBA Overall: 49.20%
    In-state: 45.09%
    Out-of-state: 46.42%
    International: 66.09%
    Overall: 60.57%
    In-state: 57.31%
    Out-of-state: 58.98%
    International: 72.03%
    Overall: 50.82%
    In-state: 49.13%
    Out-of-state: 49.73%
    International: 57.26%
    Olin College of Engineering TBA TBA 25.20% 21.66%
    Pace University TBA 78.47% 75.92% 77.14%
    Pennsylvania State University TBA TBA Overall: 60.56%
    In-state: 62.51%
    Out-of-state: 59.08%
    International: 64.37%
    Overall: 54.22%
    In-state: 57.86%
    Out-of-state: 53.12%
    International: 53.37%
    Pepperdine University TBA 67.36% 62.86% 49.85%
    Pitzer College TBA 26.80% 25.16% 16.66%
    Pomona College TBA 7.14% 7.09% 6.76%
    Princeton University TBA 4.42% 4.62% 4.50%
    Providence College TBA 49.90% 50.89% 48.58%
    Purdue University TBA Overall: 43.43%
    In-state: 71.09%
    Out-of-state: 43.58%
    International: 22.49%
    Overall: 49.79%
    In-state: 74.17%
    Out-of-state: 50.70%
    International: 27.56%
    Overall: 50.36%
    In-state: 73.99%
    Out-of-state: 50.40%
    International: 29.78%
    Reed College TBA 29.19% 24.61% 27.16%
    Rensselaer Polytechnic Institute TBA 67.25% 63.43% 58.50%
    Rhode Island School of Design TBA 23.38% 18.66% 13.81%
    Rice University 7.73% 8.01% 8.00% 7.88%
    Rochester Institute of Technology TBA TBA 66.98% 71.14%
    Rose-Hulman Institute of Technology TBA 79.29% 76.86% 72.81%
    Rutgers University–New Brunswick TBA TBA Overall: 59.73% Overall: 65.35%
    In-state: 70.72%
    Out-of-state: 71.98%
    International: 62.27%
    Sacred Heart University TBA TBA 65.36% 67.68%
    San Diego State University TBA Overall: 37.41%
    In-state: 31.32%
    Out-of-state: 90.70%
    International: 59.02%
    Overall: 35.98%
    In-state: 30.79%
    Out-of-state: 87.06%
    International: 57.06%
    Overall: 34.18%
    In-state: 29.34%
    Out-of-state: 81.08%
    International: 50.12%
    Santa Clara University TBA 47.88% 48.00% 43.84%
    Sarah Lawrence College TBA TBA 61.73% 58.93%
    Savannah College of Art and Design TBA 74.94% 82.98% 83.68%
    Scripps College TBA 39.88% 38.29% 33.94%
    Seattle University TBA TBA 76.92% 76.05%
    Seton Hall University TBA 69.00% 73.26% 78.90%
    Skidmore College TBA 23.77% 21.05% 22.92%
    Smith College TBA 22.41% 21.00% 19.73%
    Southern Methodist University TBA 47.64% 63.35% 61.22%
    Stanford University TBA 3.80% 3.61% 3.91%
    Stony Brook University TBA Overall: 48.18%
    In-state: 39.95%
    Out-of-state: 62.91%
    International: 67.09%
    Overall: 49.04%
    In-state: 41.57%
    Out-of-state: 61.68%
    International: 73.08%
    Overall: 49.01%
    In-state: 42.75%
    Out-of-state: 60.60%
    International: 71.40%
    Swarthmore College 7.44% 7.52% 7.46% 6.94%
    Syracuse University TBA TBA 45.92% 43.12%
    Texas A\&M TBA Overall: 51.66%
    In-state: 54.15%
    Out-of-state: 41.25%
    International: 48.55%
    Overall: 57.32% In-state: 59.02% Out-of-state: 48.71% International: 56.53% Overall: 63.10%
    In-state: 65.05%
    Out-of-state: 52.74%
    International: 63.50%
    Texas Christian University TBA 48.09% 44.49% 42.60%
    Texas Tech TBA Overall: 69.04% Overall: 72.65%
    In-state: 74.82%
    Out-of-state: 68.25%
    International: 33.65%
    Overall: 70.89%
    In-state: 72.30%
    Out-of-state: 68.74%
    International: 40.34%
    The New School TBA 72.62% 63.42% 62.16%
    Trinity College TBA 29.00% 29.25% 33.52%
    Trinity University TBA 24.88% 25.92% 28.16%
    Tufts University 10.00% 10.81% 11.53% 10.13%
    Tulane University ~15.00% 14.46% 13.98% 14.59%
    University at Albany TBA Overall: 70.44%
    In-state: 70.07%
    Out-of-state and international: 95.68%
    Overall: 69.09%
    In-state: 68.48%
    Out-of-state: 82.36%
    International: 55.13%
    Overall: 69.87%
    University at Buffalo TBA Overall: 80.59%
    In-state: 80.09%
    Out-of-state: 70.48%
    International: 94.42%
    Overall: 74.18%
    In-state: 76.16%
    Out-of-state: 78.99%
    International: 60.43%
    Overall: 69.30%
    In-state: 68.08%
    Out-of-state: 74.27%
    International: 73.61%
    University of California, Berkeley TBA Overall: 11.45%
    In-state: 13.55%
    Out-of-state: 10.33%
    International: 5.80%
    Overall: 11.04%
    In-state: 14.93%
    Out-of-state: 7.34%
    International: 3.38%
    Overall: 11.73%
    In-state: 15.13%
    Out-of-state: 7.80%
    International: 3.53%
    University of California, Davis TBA Overall: 44.35%
    In-state: 37.14%
    Out-of-state: 63.24%
    International: 55.94%
    Overall: 41.83%
    In-state: 36.55%
    Out-of-state: 57.32%
    International: 50.68%
    Overall: 41.64%
    In-state: 36.25%
    Out-of-state: 60.35%
    International: 49.14%
    University of California, Irvine TBA Overall: 28.70%
    In-state: 21.88%
    Out-of-state: 47.38%
    International: 41.79%
    Overall: 28.78%
    In-state: 21.82%
    Out-of-state: 49.76%
    International: 43.14%
    Overall: 25.75%
    In-state: 20.39%
    Out-of-state: 47.25%
    International: 32.56%
    University of California, Los Angeles TBA Overall: 9.41%
    In-state: 9.61%
    Out-of-state: 11.22%
    International: 6.32%
    Overall: 8.97%
    In-state: 9.53%
    Out-of-state: 9.26%
    International: 6.26%
    Overall: 8.73%
    In-state: 9.46%
    Out-of-state: 8.62%
    International: 6.09%
    University of California, Merced TBA Overall: 94.33%
    In-state: 96.30%
    Out-of-state: 83.88%
    International: 79.97%
    Overall: 91.52%
    In-state: 93.27%
    Out-of-state: 85.02%
    International: 85.03%
    Overall: 88.60%
    In-state: 91.80%
    Out-of-state: 75.97%
    International: 61.56%
    University of California, Riverside TBA Overall: 86.52%
    In-state: 86.86%
    Out-of-state: 88.84%
    International: 82.09%
    Overall: 76.85%
    In-state: 75.04%
    Out-of-state: 91.03%
    International: 84.99%
    Overall: 70.38%
    In-state: 68.50%
    Out-of-state: 85.23%
    International: 78.65%
    University of California, San Diego TBA Overall: 28.56%
    In-state: 24.75%
    Out-of-state: 39.66%
    International: 30.91%
    Overall: 26.77%
    In-state: 25.99%
    Out-of-state: 33.49%
    International: 22.44%
    Overall: 24.76%
    In-state: 24.51%
    Out-of-state: 31.92%
    International: 17.93%
    University of California, Santa Barbara TBA Overall: 38.20%
    In-state: 32.12%
    Out-of-state: 54.50%
    International: 47.59%
    Overall: 32.96%
    In-state: 32.38%
    Out-of-state: 38.21%
    International: 30.10%
    Overall: 27.78%
    In-state: 28.05%
    Out-of-state: 32.63%
    International: 21.48%
    University of California, Santa Cruz TBA Overall: 72.73%
    In-state: 71.20%
    Out-of-state: 84.12%
    International: 72.40%
    Overall: 65.57%
    In-state: 62.15%
    Out-of-state: 81.41%
    International: 77.06%
    Overall: 61.28%
    In-state: 59.56%
    Out-of-state: 80.14%
    International: 58.85%
    University of Central Florida TBA Overall: 42.80%
    In-state: 47.39%
    Out-of-state: 27.86%
    International: 24.31%
    Overall: 44.71%
    In-state: 49.12%
    Out-of-state: 28.87%
    International: 23.39%
    Overall: 43.39%
    In-state: 48.21%
    Out-of-state: 28.09%
    International: 19.27%
    University of Chicago TBA TBA 4.48% 4.79%
    University of Colorado – Boulder TBA Overall: 70.67%
    In-state: 81.31%
    Out-of-state: 66.68%
    International: 76.19%
    Overall: 76.21%
    In-state: 84.84%
    Out-of-state: 72.88%
    International: 81.54%
    Overall: 81.43%
    In-state: 92.29%
    Out-of-state: 77.22%
    International: 85.08%
    University of Connecticut TBA Overall: ~54.00% Overall: 52.39% Overall: 53.95%
    In-state: 44.94%
    Out-of-state: 56.23%
    International: 69.11%
    University of Denver TBA 85.38% 77.29% 71.19%
    University of Florida TBA Overall: 19.77% Overall: 24.20%
    In-state: 23.26%
    Out-of-state: 23.82%
    International: 32.49%
    Overall: 24.03%
    In-state: 52.58%
    Out-of-state: 14.25%
    International: 19.60%
    University of Georgia Overall: ~29.84% Overall: ~33.85% Overall: 37.92%
    In-state: 46.98%
    Out-of-state: 31.10%
    International: 20.90%
    Overall: 37.19%
    In-state: 50.24%
    Out-of-state: 28.11%
    International: 21.60%
    University of Hawaii at Manoa TBA Overall: 87.97%
    In-state: 88.71%
    Out-of-state: 88.01%
    International: 78.57%
    Overall: 86.60%
    In-state: 87.34%
    Out-of-state: 86.81%
    International: 74.57%
    Overall: 69.67%
    In-state: 80.69%
    Out-of-state: 66.56%
    International: 48.41%
    University of Illinois, Urbana-Champaign TBA Overall: 36.59% In-state: 49.32% Out-of-state: 29.03% International: 30.49% Overall: 42.37%
    In-state: 54.39%
    Out-of-state: 36.20%
    International: 33.52%
    Overall: 43.69%
    In-state: 56.23%
    Out-of-state: 35.87%
    International: 34.50%
    University of Maryland TBA Overall: 45.03%
    In-state: 43.68%
    Out-of-state and international: 45.55%
    Overall: 44.80%
    In-state: 50.89%
    Out-of-state and international: 42.54%
    Overall: 44.84%
    In-state: 53.90%
    Out-of-state and international:
    41.56%
    University of Massachusetts – Amherst TBA Overall: 59.89%
    In-state: 57.79%
    Out-of-state: 63.52%
    International: 54.13%
    Overall: 59.73%
    In-state: 60.47%
    Out-of-state: 60.95%
    International: 52.86%
    Overall: 57.77%
    Out-of-state: 58.65%
    In-state: 60.05%
    International: 47.89%
    University of Miami TBA 17.61% 18.90% 18.51%
    University of Michigan TBA 16.42% 15.64% 17.94%
    University of North Carolina at Chapel Hill TBA Overall: 16.72%
    In-state: 34.84%
    Out-of-state and international: 10.93%
    Overall: 15.34%
    In-state: 37.99%
    Out-of-state: 6.63%
    International: 14.28%
    Overall: 18.74%
    In-state: 41.16%
    Out-of-state: 9.33%
    International: 18.22%
    University of North Carolina at Charlotte TBA Overall: 77.78%
    In-state: 82.71%
    Out-of-state: 66.85%
    International: 70.00%
    Overall: 79.60%
    In-state: 84.38%
    Out-of-state: 67.38%
    International: 73.95%
    Overall: 80.21%
    In-state: 85.96%
    Out-of-state: 65.45%
    International: 66.92%
    University of Notre Dame 9.00% 9.38% 11.27% 12.38%
    University of Pennsylvania TBA 4.92% 5.40% 5.87%
    University of Pittsburgh TBA Overall: 59.45% Overall: 58.09% Overall: 49.70%
    University of Rhode Island TBA TBA Overall: 72.16%
    In-state: 74.58%
    Out-of-state: 71.80%
    International: 67.41%
    Overall: 77.07%
    In-state: 75.89%
    Out-of-state: 77.40%
    International: 72.83%
    University of Richmond TBA 22.24% 22.20% 23.31%
    University of Rochester TBA Overall: 41.91% Overall: 40.08%
    College of Arts, Sciences and Engineering: 40.13%
    Eastman School of Music: 39.00%
    Overall: 35.85%
    College of Arts, Sciences and Engineering: 35.81%
    Eastman School of Music: 36.89%
    University of San Diego TBA 53.58% 52.38% 46.81%
    University of South Carolina TBA TBA Overall: 60.15%
    In-state: 76.17%
    Out-of-state: 54.72%
    International: 65.32%
    Overall: 61.49%
    In-state: 77.50%
    Out-of-state: 55.60%
    International: 62.02%
    University of Southern California 11.67% 11.19% 9.81% 10.01%
    University of Tennessee – Knoxville Overall: 47.81%
    In-state: 76.00%
    Out-of-state: 40.37%
    International: 63.92%
    Overall: 43.58%
    In-state: 72.83%
    Out-of-state: 35.08%
    International: 47.12%
    Overall: 41.60%
    In-state: 70.10%
    Out-of-state: 33.37%
    International: 28.59%
    Overall: 45.99%
    In-state: 60.40%
    Out-of-state: 43.02%
    International: 35.19%
    University of Texas at Austin TBA Overall: 22.22% Overall: 26.64%
    In-state: 37.72%
    Out-of-state: 10.13%
    International: 12.87%
    Overall: 29.12%
    In-state: 40.97%
    Out-of-state: 11.76%
    International: 13.24%
    University of Vermont TBA Overall: 73.04%
    In-state: 76.54%
    Out-of-state: 75.19%
    International: 30.44%
    Overall: 65.30%
    In-state: 74.15%
    Out-of-state: 65.68%
    International: 34.91%
    Overall: 60.02%
    In-state: 71.43%
    Out-of-state: 59.83%
    International: 32.83%
    University of Virginia In-state: 21.62%
    Out-of-state and international: 9.61%
    In-state: 23.50%
    Out-of-state: 12.91%
    International: 11.62%
    In-state: 25.93%
    Out-of-state: 13.83%
    International: 10.46%
    In-state: 27.58%
    Out-of-state: 13.18%
    International: 11.50%
    University of Washington – Seattle TBA Overall: 41.75%
    In-state: 45.74%
    Out-of-state: 42.16%
    International: 35.64%
    Overall: 39.15%
    In-state: 47.85%
    Out-of-state: 36.20%
    International: 38.83%
    Overall: 42.53%
    In-state: 52.27%
    Out-of-state: 38.46%
    International: 45.42%
    University of Wisconsin – Madison TBA Overall: 40.81%
    In-state: 56.39%
    Out-of-state: 40.33%
    International: 31.60%
    Overall: 45.17%
    In-state: 59.27%
    Out-of-state: 45.55%
    International: 33.26%
    Overall: 43.24%
    In-state: 60.67%
    Out-of-state: 42.67%
    International: 31.91%
    Vanderbilt University ~4.08% 5.33% 5.86% 6.28%
    Vassar College TBA 20.93% 18.57% 17.73%
    Villanova University TBA 27.53% 26.98% 25.12%
    Virginia Tech TBA In-state: 47.33%
    Out-of-state: 58.87%
    International: 57.57%
    In-state: 47.65%
    Out-of-state: 59.06%
    International: 66.04%
    In-state: 47.08%
    Out-of-state: 63.16%
    International: 68.01%
    Wake Forest University TBA 20.76% 21.67% 21.56%
    Washington and Lee University TBA 13.39% 13.97% 17.36%
    Washington University in St. Louis TBA 11.92% 12.06% 11.96%
    Wellesley College TBA 14.79% 14.05% 13.91%
    Wesleyan University 15.78% 16.11% 16.49% 17.10%
    Willamette University TBA TBA 77.09% 79.08%
    William & Mary Overall: 34.43% Overall: 36.96% Overall: 34.09%
    In-state: 36.32%
    Out-of-state and international: 34.43%
    Overall: 32.72%
    In-state: 39.28%
    Out-of-state and international: 28.19%
    Williams College 7.48% 8.61% 8.25% 9.99%
    Worcester Polytechnic Institute TBA 61.89% 60.16% 58.50%
    Yale University 4.24% 4.75% 3.87% 4.50%

    Note: “TBA” means the school has not yet released or confirmed the admit-rate data in this chart. Approximate rates are marked with “~.”

    The college admissions landscape remains highly competitive for the Class of 2030.

    As colleges continue releasing admissions data, early numbers show that many selective universities are maintaining historically low acceptance rates, while public universities continue to show major differences between in-state, out-of-state, and international applicants.


    What Are Admit Rates?

    A college’s admit rate, also called an acceptance rate, is the percentage of applicants who are offered admission.

    For example, if a college receives 50,000 applications and admits 5,000 students, its admit rate is 10%.

    However, admit rates do not tell the full story. Many colleges admit students through different rounds, including Early Decision, Early Action, Regular Decision, transfer admission, and special programs. Public universities may also have very different admit rates for in-state and out-of-state students.


    Class of 2030 Admissions: Key Trends

    The Class of 2030 admissions cycle shows that competition at top colleges remains intense. Several highly selective schools reported admit rates below 10%, including Brown, Columbia, Dartmouth, Duke, MIT, Vanderbilt, Williams, Amherst, Bowdoin, and Yale.

    Some schools became even more selective compared with the previous year. For example, Columbia’s admit rate decreased from 4.94% for the Class of 2029 to 4.23% for the Class of 2030. Duke also dropped from 5.20% to 4.73%, while Vanderbilt declined from 5.33% to approximately 4.08%.

    At the same time, not every school followed the same pattern. Some universities remained relatively stable, while others became slightly less selective. This shows why students should avoid relying only on national headlines and instead look carefully at each college’s individual data.


    Highly Selective Colleges Remain Extremely Competitive

    Many of the most selective colleges continue to admit only a small percentage of applicants. Current Class of 2030 admit rates include:

    School Class of 2030 Admit Rate
    Columbia University4.23%
    Yale University4.24%
    Massachusetts Institute of Technology4.58%
    Duke University4.73%
    Brown University5.35%
    Dartmouth College5.84%
    Bowdoin College6.53%
    Amherst College6.78%
    Williams College7.48%
    Rice University7.73%
    University of Notre Dame9.00%
    Tufts University10.00%
    University of Southern California11.67%
    Boston College12.70%
    Georgetown University13.00%

    These numbers make it clear that strong grades and test scores are only part of the admissions process. At highly selective schools, students also need strong essays, meaningful extracurricular involvement, academic focus, and a thoughtful college list.


    Public University Admit Rates Can Vary by Residency

    For many public universities, the overall acceptance rate does not tell the full story. In-state applicants often have a much higher admit rate than out-of-state or international applicants.

    For example, Georgia Tech reported a Class of 2030 overall admit rate of 12.82%, but the in-state admit rate was approximately 27.64%, while the out-of-state and international admit rate was approximately 9.28%.

    The University of Virginia also shows a major residency gap. For the Class of 2030, UVA reported:

    Applicant Type Class of 2030 Admit Rate
    In-state21.62%
    Out-of-state and international9.61%

    This matters because many families look at a school’s overall admit rate and assume it applies equally to all applicants. In reality, a student’s residency status can significantly affect admissions chances at public universities.


    Colleges With Notable Class of 2030 Admit Rates

    Below are several schools that have already released Class of 2030 admit-rate data:

    School Class of 2030 Class of 2029 Class of 2028 Class of 2027
    Amherst College6.78%7.72%9.01%9.81%
    Boston College12.70%13.85%16.19%15.65%
    Bowdoin College6.53%6.81%7.13%8.02%
    Brown University5.35%5.65%5.39%5.23%
    Columbia University4.23%4.94%3.86%4.00%
    Dartmouth College5.84%6.02%5.40%6.23%
    Duke University4.73%5.20%5.71%6.78%
    Georgetown University13.00%13.49%12.91%13.08%
    Georgia Tech12.82%13.34%14.07%16.46%
    Lafayette College32.27%31.16%31.45%31.40%
    MIT4.58%4.56%4.55%4.80%
    Rice University7.73%8.01%8.00%7.88%
    Swarthmore College7.44%7.52%7.46%6.94%
    Tufts University10.00%10.81%11.53%10.13%
    Tulane University~15.00%14.46%13.98%14.59%
    University of Notre Dame9.00%9.38%11.27%12.38%
    University of Southern California11.67%11.19%9.81%10.01%
    Vanderbilt University~4.08%5.33%5.86%6.28%
    Wesleyan University15.78%16.11%16.49%17.10%
    William & Mary34.43%36.96%34.09%32.72%
    Williams College7.48%8.61%8.25%9.99%
    Yale University4.24%4.75%3.87%4.50%

    Why Admit Rates Are Getting Lower at Many Colleges

    There are several reasons why admit rates have become lower at many selective colleges.

    First, many schools have received larger applicant pools in recent years. Test-optional policies, increased national awareness, and easier application platforms have encouraged more students to apply to more colleges.

    Second, students are building longer college lists. Instead of applying to 6 or 8 schools, many competitive applicants now apply to 12, 15, or even 20 colleges.

    Third, colleges are carefully managing yield, which means they are trying to predict how many admitted students will actually enroll. This can lead to more waitlist activity and more strategic admissions decisions.

    Finally, top colleges are not just looking for qualified students. They are building a balanced class. Academic excellence matters, but so do essays, recommendations, extracurricular depth, institutional priorities, geographic diversity, major interest, and personal background.


    What This Means for Students

    For students applying to college, the most important takeaway is that admit rates should guide strategy, not create panic.

    A low admit rate does not mean a student should avoid applying. However, it does mean students need a balanced college list with reach, target, and likely schools.

    Students should also avoid assuming that past admission trends will perfectly predict future outcomes. A school that admitted 15% of applicants last year may become more selective this year depending on application volume, institutional goals, and yield management.

    The strongest applicants usually have three things in common:

    1. They build a smart, balanced college list.
    2. They present a clear academic and personal story.
    3. They start early enough to create thoughtful applications.

    How to Use This Class of 2030 Admit Rate List

    Students and families can use this list to understand how competitive each college has been over the past several years. When comparing schools, pay attention to:

    • Whether the admit rate is overall or separated by residency
    • Whether the rate includes Early Decision, Early Action, and Regular Decision
    • Whether the school has a special college, campus, or program with separate admission standards
    • Whether the school’s admit rate has been rising, falling, or staying stable

    For public universities, students should be especially careful with residency-based numbers. An out-of-state applicant may face a very different level of competition than an in-state applicant.


    Final Thoughts

    The Class of 2030 admissions cycle confirms that college admissions remains highly competitive, especially at selective private universities and popular public flagships. While admit rates are useful, they should not be the only factor students consider when building a college list.

    A thoughtful application strategy should include academic fit, major availability, financial affordability, campus culture, location, and realistic admissions chances.

    As more colleges release Class of 2030 data, this article will continue to be updated with the latest admit rates and admissions trends.

  • Unlocking the BS/MD Program: A Guide for High School Students in Oregon

    Unlocking the BS/MD Program: A Guide for High School Students in Oregon

    College Admissions

    Complete BS/MD Program List: What Students Should Know Before Applying

    For high-achieving high school students who are serious about becoming physicians, BS/MD programs can be one of the most attractive — and competitive — college pathways in the United States.

    A BS/MD program allows students to apply to an undergraduate institution and medical school pathway at the same time. In many cases, students receive conditional acceptance to medical school while still in high school. That can reduce some of the uncertainty of the traditional pre-med route, but it also means the application process is extremely selective.

    Many BS/MD programs have very small class sizes, strict GPA requirements, MCAT requirements, interview rounds, and residency preferences. Program details can also change from year to year, so students should always confirm requirements directly with each school’s official website before applying.

    Why BS/MD Programs Are So Competitive

    BS/MD programs are not simply “strong pre-med tracks.” They are early medical school pathways. That means colleges are not only evaluating whether a student can succeed in college, but also whether the student is mature, academically prepared, service-minded, and genuinely committed to medicine.

    These programs are highly competitive because they offer students a conditional medical school pathway earlier than the traditional application process. Acceptance rates, class sizes, and program requirements can vary widely by school.

    Students applying to BS/MD programs usually need:

    • Strong GPA and rigorous coursework
    • High SAT or ACT scores, when considered
    • Clinical exposure or medical volunteering
    • Research experience
    • Leadership and service
    • A clear reason for pursuing medicine
    • Strong essays and interview preparation

    Top BS/MD Programs Students Often Consider

    Below are some of the most recognized BS/MD programs in the U.S. These programs are often highly selective and may include additional requirements such as interviews, minimum college GPA standards, MCAT expectations, or residency preferences.

    Program Location Typical Length Notes
    Brown University PLME Providence, RI 8 years One of the most well-known liberal medical education programs
    Rice University / Baylor College of Medicine Houston, TX 8 years Extremely selective with very limited seats
    Case Western Reserve PPSP Cleveland, OH 8 years Strong academic and research-focused pathway
    University of Pittsburgh GAP Pittsburgh, PA 8 years Highly competitive guaranteed admission pathway
    University of Rochester REMS Rochester, NY 8 years Small cohort and highly selective
    RPI / Albany Medical College Troy, NY 7 years Accelerated BS/MD option
    Union College / Albany Medical College Schenectady, NY 8 years Combined liberal arts and medical pathway
    UMKC BA/MD Kansas City, MO 6 years One of the best-known accelerated medical programs
    Drexel University BS/MD Philadelphia, PA 8 years Large BS/MD seat count compared with many programs
    George Washington University BA/MD Washington, DC 7 years Small cohort and highly selective
    Howard University BS/MD Washington, DC 6 years Accelerated pathway for Howard students
    UConn Special Program in Medicine Connecticut 8 years Gives special consideration to Connecticut residents
    Stony Brook BS/MD Stony Brook, NY 8 years Small cohort and competitive admission process
    SUNY Upstate Accelerated Scholars Syracuse, NY 7–8 years Strong option for New York students
    Virginia Commonwealth University BS/MD Richmond, VA 8 years Well-known direct medical pathway

    Complete BS/MD Program List by State

    The following list is organized by state for easier student research. Because BS/MD program availability and requirements can change, families should always verify final details directly through each college or medical school.

    Alabama

    • University of Alabama School of Medicine EMSAP
    • University of South Alabama COMEAP

    Arizona

    • University of Arizona Tucson APME

    California

    • UC Merced / UCSF Fresno SJV PRIME+
    • California Northstate University BS/MD Honors Track

    Colorado

    • CU Denver BS/MD

    Connecticut

    • UConn Special Program in Medicine

    Washington, D.C.

    • George Washington University BA/MD
    • Howard University BS/MD

    Florida

    • Florida Atlantic University BS/MD
    • Florida International University BS/MD
    • University of South Florida BS/MD
    • Nova Southeastern BS/MD

    Georgia

    • Augusta BS/MD
    • Mercer University BS/MD

    Illinois

    • University of Illinois Chicago GPPA
    • DePaul University / Rosalind Franklin University BS/MD

    Indiana

    • University of Evansville B/MD
    • University of Southern Indiana B/MD
    • Indiana University Pathway to Medicine
    • Ball State University BS/MD

    Kentucky

    • University of Louisville GEMS BS/MD

    Louisiana

    • Tulane Pathway to Medicine
    • Grambling State University / Meharry BS/MD

    Michigan

    • Wayne State Med Direct BS/MD

    Minnesota

    • University of Minnesota BA/MD

    Missouri

    • University of Missouri–Kansas City BA/MD
    • Saint Louis University Medical Scholars Program

    New Jersey

    • Caldwell University / NJMS BS/MD
    • Drew University / NJMS BS/MD
    • Saint Peter’s University / NJMS BS/MD
    • New Jersey Institute of Technology / NJMS BS/MD
    • The College of New Jersey / NJMS BS/MD
    • Rutgers University–Newark / NJMS BS/MD
    • Stevens Institute of Technology / NJMS BS/MD
    • Montclair State University / NJMS BS/MD
    • Rowan University BS/MD
    • Seton Hall / Hackensack BS/MD

    New Mexico

    • University of New Mexico BA/MD

    New York

    • Brooklyn College / Sophie Davis BS/MD
    • CCNY / Sophie Davis BS/MD
    • Hofstra BS/MD
    • Rensselaer Polytechnic Institute / Albany Medical College BS/MD
    • Union College / Albany Medical College BS/MD
    • Siena College / Albany Medical College BA/MD
    • University of Rochester REMS
    • Stony Brook BS/MD
    • SUNY Upstate Accelerated Scholars BS/MD

    Ohio

    • Case Western Reserve PPSP BS/MD
    • University of Cincinnati BS/MD
    • University of Toledo BACC2MD

    Oklahoma

    • University of Oklahoma BA/MD
    • University of Tulsa ECM BS/MD

    Pennsylvania

    • Drexel University BS/MD
    • Penn State / Sidney Kimmel PMM BS/MD
    • Washington & Jefferson / Lewis Katz School of Medicine BS/MD
    • University of Pittsburgh GAP BS/MD
    • Wilkes University / Penn State BS/MD
    • Wilkes University / Geisinger BS/MD

    Rhode Island

    • Brown University PLME

    South Carolina

    • University of South Carolina BS/MD

    Tennessee

    • Meharry / Middle Tennessee State University Medical School Early Acceptance Program

    Texas

    • Baylor University BS/MD
    • Texas A&M E2ENMED
    • Texas Tech UMSI BS/MD
    • University of Houston HonorsMed
    • University of Texas Rio Grande Valley Vaqueros MD

    Virginia

    • Virginia Commonwealth University BS/MD

    Important Differences Between BS/MD Programs

    Not every BS/MD program works the same way. Some are true guaranteed admission programs, while others are conditional pathways or guaranteed interview programs. Some programs require the MCAT, while others may waive it if students meet specific academic standards.

    Students should compare programs based on:

    • Program length: 6, 7, or 8 years
    • MCAT requirement: required, waived, or restricted
    • Minimum college GPA requirement
    • Number of available seats
    • In-state or regional preference
    • Undergraduate major flexibility
    • Research and clinical opportunities
    • Medical school match and location

    6-Year, 7-Year, and 8-Year BS/MD Programs

    One major difference between BS/MD programs is length. Some programs are accelerated, while others give students a more traditional undergraduate experience before medical school.

    6-Year BS/MD Programs

    A 6-year BS/MD program is highly accelerated. Students move quickly through undergraduate coursework and medical school preparation. UMKC BA/MD and Howard University BS/MD are examples of shorter accelerated pathways.

    7-Year BS/MD Programs

    A 7-year BS/MD program can save one year compared with the traditional route. Examples include George Washington BA/MD, RPI/Albany Medical College, and Penn State/Sidney Kimmel PMM.

    8-Year BS/MD Programs

    An 8-year BS/MD program gives students a more traditional undergraduate experience while still offering a medical school pathway. Brown PLME, Case Western PPSP, University of Rochester REMS, Drexel, VCU, and many other programs follow an 8-year structure.

    What Makes a Strong BS/MD Applicant?

    A strong BS/MD applicant needs more than excellent grades. These programs are looking for students who already understand the responsibilities of medicine.

    Strong applicants often have:

    • Advanced science and math coursework
    • Excellent grades in AP, IB, honors, or dual enrollment classes
    • High standardized test scores when submitted
    • Hospital volunteering or physician shadowing
    • Community service connected to health care or underserved groups
    • Research experience
    • Leadership in school or community organizations
    • Clear writing about why medicine matters to them

    Because BS/MD interviews can be intense, students also need to explain their motivation naturally. They should be able to talk about patient care, ethics, service, scientific curiosity, and long-term commitment — not just prestige or job security.

    Common Mistakes Students Make

    Many students apply to BS/MD programs too casually. These programs are often more selective than regular undergraduate admissions. A student may be competitive for a top university but still not be competitive for its BS/MD pathway.

    Common mistakes include:

    • Applying without enough medical exposure
    • Writing generic “I want to help people” essays
    • Underestimating interview preparation
    • Ignoring state residency preferences
    • Not checking MCAT and GPA continuation requirements
    • Applying only to reach-level BS/MD programs
    • Failing to build a balanced college list

    A smart BS/MD strategy should include reach BS/MD programs, regular pre-med target schools, honors colleges, and affordable safety options.

    Final Takeaway

    BS/MD programs can be an excellent option for students who are deeply committed to medicine, but they are not easy shortcuts. They require early preparation, strong academic performance, meaningful activities, and a clear personal story.

    Families should use BS/MD lists as a starting point, not a final application plan. Program availability, requirements, MCAT policies, and seat counts can change from year to year. Before applying, always confirm details on each school’s official website and build a balanced list that includes both BS/MD and traditional pre-med options.

    For students who want to become physicians, the goal is not just to get into a BS/MD program. The goal is to find the right academic environment where they can grow into a strong future doctor.

    Need Help Building a BS/MD or Pre-Med College List?

    MMT Prep helps students plan competitive college admissions strategies, including BS/MD programs, pre-med pathways, essays, activities, and interview preparation.

    Contact MMT Prep today to start building a smarter college application plan.

  • Colleges Reinstating SAT and ACT Requirements: What Students Should Know

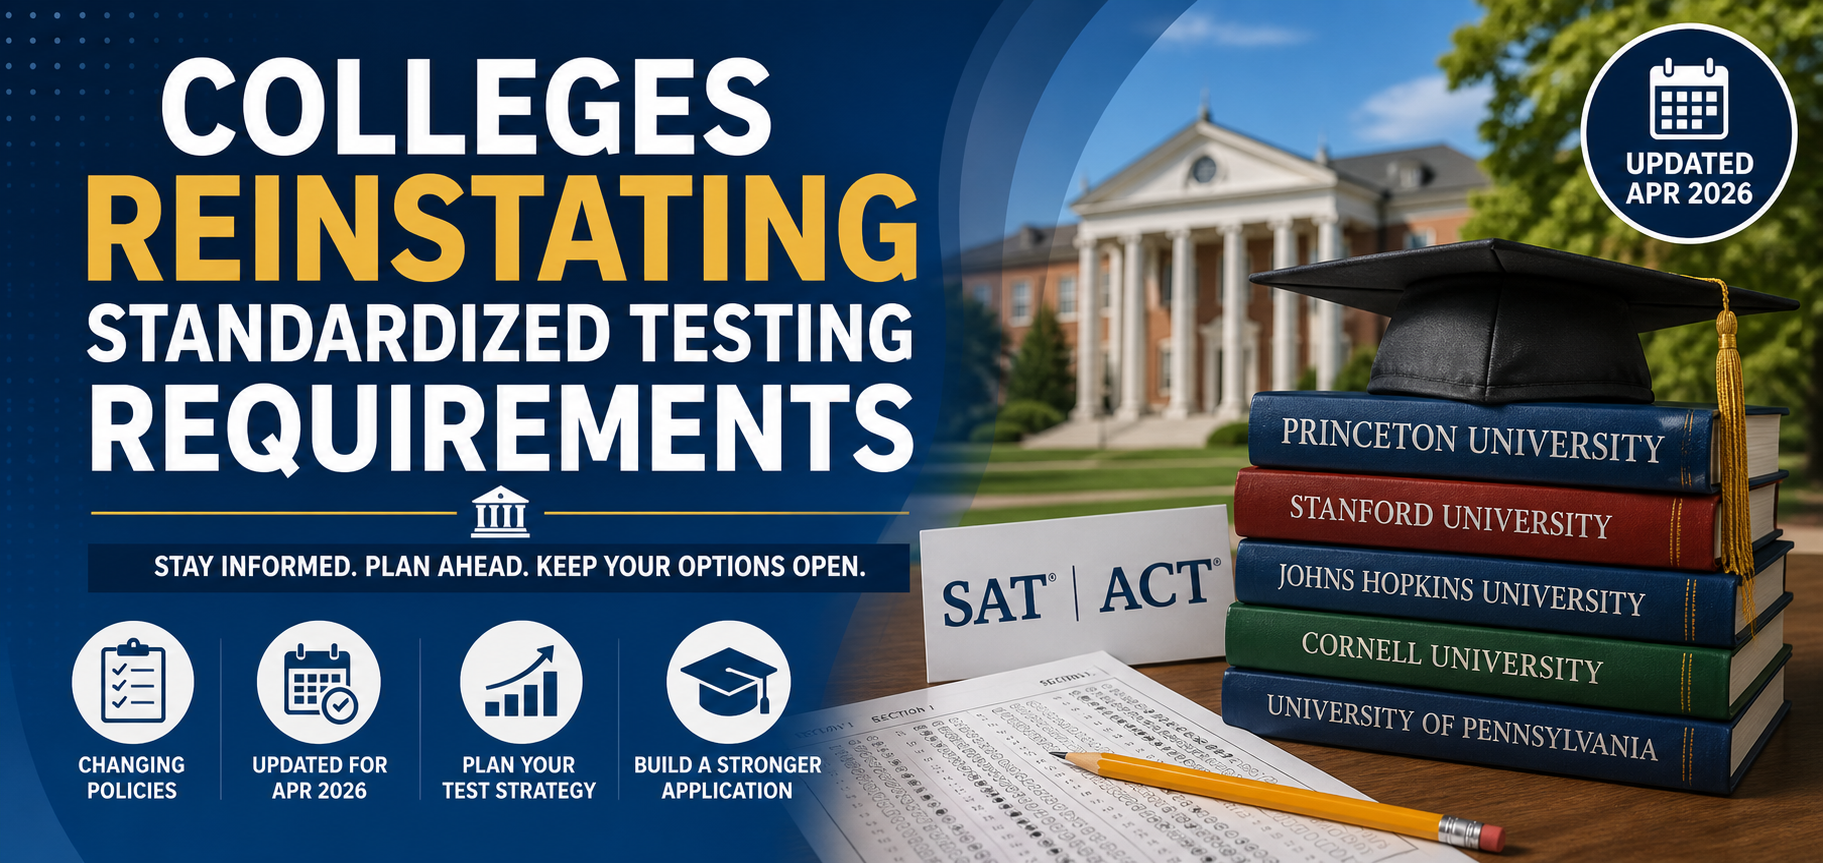
    Colleges Reinstating SAT and ACT Requirements: What Students Should Know

    College Admissions

    Colleges Reinstating SAT and ACT Requirements: What Students Should Know

    After several years of test-optional admissions, more colleges are bringing back standardized testing requirements. For students applying in the coming admissions cycles, SAT and ACT planning is becoming important again.

    The Return of Standardized Testing

    During the COVID-19 pandemic, many colleges temporarily moved to test-optional admissions because students had limited access to SAT and ACT testing sites. Now, the admissions landscape is shifting again. While many colleges still remain test-optional, a growing number of selective institutions have announced that SAT or ACT scores will once again be required for admission.

    This does not mean every college is bringing back testing. However, it does mean students should no longer assume that test-optional policies will stay the same from year to year. Testing policies can change quickly, and students should check each college’s official admissions website before applying.

    College Kickstart’s updated April 2026 list shows several institutions reinstating standardized testing requirements for recent and upcoming application cycles, including schools such as Princeton, Claremont McKenna, Carnegie Mellon, Cornell, Johns Hopkins, Stanford, University of Pennsylvania, and others. Source: College Kickstart

    Why Are Some Colleges Bringing Back SAT and ACT Requirements?

    Colleges have given different reasons for returning to standardized testing. Some institutions argue that test scores provide useful academic information when reviewed alongside grades, course rigor, essays, recommendations, and extracurricular activities. Others believe that standardized testing can help identify talented students from schools where fewer advanced courses or enrichment opportunities are available.

    Johns Hopkins, for example, states on its admissions website that first-year applicants are required to submit SAT or ACT scores and that scores are reviewed as part of a holistic admissions process. Source: Johns Hopkins Undergraduate Admissions

    This is part of a larger national trend. Harvard, Yale, Brown, Dartmouth, MIT, and other highly selective schools have also moved away from fully test-optional admissions in recent years, showing that standardized testing is becoming relevant again at many competitive colleges. Source: Associated Press

    Colleges Reinstating Standardized Testing Requirements

    The table below summarizes selected colleges that have reinstated or announced plans to reinstate SAT/ACT requirements. Students should always verify the latest policy directly through each college’s admissions website before applying.

    Institution State Admit Rate Middle 50% SAT / ACT Cycle Reinstated Notes
    Princeton University NJ 4% 1500–1560 / 34–35 2027–28
    Claremont McKenna College CA 9% 1480–1540 / 33–35 2027–28
    Auburn University AL 46% 1260–1380 / 26–31 2026–27 Test submission was already strongly encouraged.
    University of Alabama AL 77% 1110–1360 / 22–30 2026–27 Phased return: GPA below 3.0 required first; universal requirement for Fall 2028.
    Louisiana State University LA 73% 1180–1320 / 24–30 2026–27 Phased return: GPA below 3.5 required first; universal requirement for Fall 2028.
    Carnegie Mellon University PA 11% 1500–1560 / 34–36 2025–26 Flexible policy; required for Computer Science; optional for Fine Arts.
    Cornell University NY 8% 1510–1560 / 33–35 2025–26
    Georgia Southern University GA 88% 970–1140 / 18–23 2025–26 Part of the University System of Georgia’s shift.
    Georgia State University GA 55% 980–1200 / 19–26 2025–26 Part of the University System of Georgia’s shift.
    Johns Hopkins University MD 6% 1530–1560 / 34–36 2025–26
    Kennesaw State University GA 69% 1010–1210 / 19–26 2025–26 Part of the University System of Georgia’s shift.
    Ohio State University OH 61% 1280–1430 / 26–32 2025–26
    Stanford University CA 4% 1510–1570 / 34–35 2025–26
    University of Miami FL 18% 1350–1450 / 30–33 2025–26
    University of Pennsylvania PA 5% 1510–1570 / 34–36 2025–26

    Note: This table is based on the College Kickstart April 2026 update and should be used as a starting point. Always confirm directly with each college because testing policies may change.

    What This Means for Students Applying to College

    Students should treat testing as part of their admissions strategy again. Even when a college is still test-optional, a strong SAT or ACT score can help support an application, especially at selective schools where many applicants already have strong grades and rigorous coursework.

    This is especially important for students applying to competitive majors such as computer science, engineering, business, pre-med tracks, economics, and other high-demand programs. At some universities, admission to the major may be more selective than admission to the university overall.

    Should Students Still Take the SAT or ACT?

    In most cases, yes. Even if every school on a student’s current college list is test-optional, that list may change later. A student may add a college that requires testing, or a school may update its policy before the student applies.

    Taking the SAT or ACT gives students more flexibility. If the score is strong, they can submit it. If the score does not help the application and the college is test-optional, they may choose not to submit it.

    Student Situation Testing Recommendation
    Applying to highly selective colleges Plan to take the SAT or ACT. Strong scores may be expected or helpful.
    Applying to schools that have reinstated testing Testing is required, so students should prepare early.
    Applying to test-optional colleges Still consider testing. A strong score can improve the application.
    Applying for merit scholarships Check scholarship rules carefully. Some scholarships may still consider or require scores.
    Unsure about college list Take the SAT or ACT to keep more options open.

    Test-Optional Does Not Always Mean Test-Blind

    One common misunderstanding is that “test-optional” means colleges ignore test scores. That is not true. Test-optional means students may choose whether to submit SAT or ACT scores. If students submit scores, colleges may still consider them as part of the application review.

    Test-blind is different. A test-blind college does not consider SAT or ACT scores even if the student submits them. Because policies vary, students should carefully check whether a school is test-required, test-optional, test-flexible, or test-blind.

    How to Build a Testing Plan

    Students should begin by reviewing the testing policies for every college on their list. Then they should decide whether the SAT or ACT is a better fit. Some students perform better on the SAT, while others are stronger on the ACT.

    A smart testing plan usually includes:

    • Taking a diagnostic SAT and ACT to compare performance
    • Choosing one test to focus on
    • Preparing consistently for several months
    • Taking the official test more than once if needed
    • Checking score ranges for target colleges
    • Reviewing whether scores are needed for scholarships or specific majors

    When Should Students Start Preparing?

    Students should avoid waiting until senior year to begin thinking about standardized testing. A good timeline is to take a diagnostic test during sophomore year or early junior year, prepare during junior year, and complete official testing before senior-year applications become overwhelming.

    For students aiming at highly selective colleges, early planning matters. The strongest applicants often combine rigorous courses, strong grades, meaningful extracurricular involvement, thoughtful essays, and competitive test scores.

    Final Takeaway

    Standardized testing is not disappearing from college admissions. In fact, several selective colleges have already brought back SAT and ACT requirements, and more may follow. While test-optional admissions still exist at many schools, students should be careful not to assume that testing no longer matters.

    The safest strategy is to prepare early, understand each college’s policy, and keep testing as an available option. A strong score can strengthen a college application, support scholarship opportunities, and give students more flexibility when building a balanced college list.

  • Unlocking Opportunities: QuestBridge for High-Achieving Students

    Unlocking Opportunities: QuestBridge for High-Achieving Students

    College Admissions

    What Is QuestBridge? A Guide for High-Achieving Students

    QuestBridge is one of the most important college admissions programs for high-achieving students from low-income backgrounds. Through its National College Match program, eligible students may be able to earn admission to a top college with a full four-year scholarship.

    What Is QuestBridge?

    QuestBridge is a nonprofit organization that connects high-achieving students from low-income backgrounds with leading colleges and universities in the United States. Its best-known program is the National College Match, which gives qualified high school seniors the opportunity to apply to multiple top colleges through one application process.

    The goal of QuestBridge is to help talented students access colleges that might otherwise feel financially out of reach. Many QuestBridge partner colleges are among the most selective schools in the country, including major research universities and liberal arts colleges.

    What Is the QuestBridge National College Match?

    The National College Match is a special college application and scholarship process for high school seniors. Students submit a QuestBridge application, and QuestBridge selects a group of applicants as Finalists. Finalists can then rank QuestBridge partner colleges in order of preference.

    If a student “matches” with one of the colleges they ranked, they are admitted early and receive a full four-year Match Scholarship. According to QuestBridge, the scholarship can be worth over $325,000 and may cover tuition, housing, food, and other expenses.

    Source: QuestBridge National College Match

    Who Is QuestBridge For?

    QuestBridge is designed for students who have strong academic records but come from families with limited financial resources. QuestBridge states that strong applicants are typically students who earn mostly A’s in challenging courses, demonstrate intellectual curiosity, and come from households earning less than about $65,000 per year for a family of four, with minimal assets.

    Students may also be strong fits if they qualify for free or reduced-price school meals, face financial hardship, or have significant family responsibilities.

    QuestBridge Looks For What It Means
    Academic Strength Mostly A grades, rigorous classes, strong writing ability, and intellectual curiosity.
    Financial Need Typically a household income under about $65,000 for a family of four, with limited assets.
    Personal Qualities Resilience, motivation, leadership, responsibility, and strong character.
    College Readiness A student who is prepared to succeed at a highly selective college or university.

    Source: QuestBridge Application Eligibility

    How Does QuestBridge Work?

    The QuestBridge process is different from a traditional college application. Students are not simply applying to one college at a time. Instead, they first apply through QuestBridge, then may become Finalists, rank colleges, and submit each college’s required materials.

    Step 1: Submit the QuestBridge Application

    Students submit the National College Match application, which usually includes academic information, financial information, essays, recommendation letters, extracurricular activities, and other personal background details.

    Step 2: Become a Finalist

    QuestBridge reviews applications and selects Finalists. Being named a Finalist does not guarantee admission to a college, but it allows the student to continue in the Match process.

    Step 3: Rank Partner Colleges

    Finalists can rank QuestBridge college partners in order of preference. This is an important decision because, for most colleges, the Match is binding. That means if the student matches with a school they ranked, they are expected to attend that college.

    Step 4: Submit Match Requirements

    Each college may require additional materials, such as financial documents, supplemental essays, test scores if applicable, or other forms. QuestBridge reminds students that Match Requirements vary by school, so students must carefully check each college’s instructions.

    Step 5: Receive Match Results

    In December, Finalists learn whether they matched with one of the colleges they ranked. If they match, they receive admission and a full four-year scholarship from that college.

    Source: How the National College Match Works

    What Happens If a Student Does Not Match?

    Not matching does not mean the student is rejected from all QuestBridge colleges. Many students who do not match can still apply to QuestBridge partner colleges through Regular Decision or other application rounds. In many cases, students may still receive generous financial aid from partner colleges.

    This is one reason QuestBridge can still be valuable even for students who are not matched in December. The application helps students present their academic achievement, financial background, personal story, and resilience in a detailed way.

    Is QuestBridge Only for Ivy League Students?

    No. QuestBridge is not only for students applying to Ivy League schools. While some QuestBridge partner colleges are Ivy League universities, the program also includes many top liberal arts colleges, research universities, and highly respected institutions across the country.

    The better question is not “Is this student Ivy League material?” but rather: Has this student achieved at a high level despite financial challenges? QuestBridge is designed to recognize students who have shown academic excellence, maturity, and determination in difficult circumstances.

    Benefits of Applying Through QuestBridge

    Benefit Why It Matters
    Full Four-Year Scholarship Matched students may receive a scholarship covering tuition, housing, food, and other expenses.
    Access to Top Colleges Students can be considered by some of the most selective colleges in the country.
    Application Fee Support QuestBridge Finalists often receive waived application fees at partner colleges.
    Story-Based Application The QuestBridge application gives students room to explain family responsibilities, financial hardship, resilience, and personal growth.
    Regular Decision Opportunities Students who do not match may still apply to partner colleges through later rounds.

    Is QuestBridge Competitive?

    Yes. QuestBridge is highly competitive because it is aimed at students who are both academically strong and financially eligible. Students should not assume that financial need alone is enough. Successful applicants usually show strong grades, challenging coursework, meaningful extracurricular activities, leadership, maturity, and strong essays.

    At the same time, students do not need to be perfect. QuestBridge understands that low-income students may have had fewer opportunities, more family responsibilities, work obligations, or limited access to expensive test prep and extracurricular programs.

    Who Should Consider Applying?

    A student should strongly consider QuestBridge if they:

    • Are a high school senior applying to college
    • Have strong grades in rigorous classes
    • Come from a low-income household
    • Have limited family assets
    • Can explain their personal story clearly and honestly
    • Are interested in attending a selective college or university
    • Need significant financial aid to make college affordable

    Common Misunderstandings About QuestBridge

    Misunderstanding 1: “QuestBridge is only for perfect students.”

    QuestBridge is competitive, but it is not only for students with perfect grades or perfect test scores. The application is holistic and considers academic achievement, financial background, personal challenges, and character.

    Misunderstanding 2: “If I do not match, I failed.”

    Not matching does not mean the student failed. Many students who do not match still go on to attend excellent colleges with strong financial aid packages.

    Misunderstanding 3: “The Match is the same as regular college admission.”

    The Match is different because students rank colleges and may receive a binding early admission offer with a full scholarship. Students should understand the commitment before ranking schools.

    Misunderstanding 4: “QuestBridge is only about income.”

    Financial need is very important, but QuestBridge also looks for academic strength, intellectual curiosity, resilience, and motivation.

    How Students Can Strengthen Their QuestBridge Application

    The strongest QuestBridge applications are honest, detailed, and personal. Students should not try to sound like someone else. Instead, they should clearly explain their background, responsibilities, goals, and academic journey.

    Strong applications often include:

    • A clear explanation of the student’s family and financial circumstances
    • Specific examples of academic curiosity and motivation
    • Essays that show resilience without exaggerating hardship
    • Recommendation letters from teachers who know the student well
    • Evidence of leadership, responsibility, work experience, or community involvement
    • A thoughtful college ranking list based on fit, not just prestige

    Final Thoughts: Is QuestBridge Worth It?

    For the right student, QuestBridge can be life-changing. It can open the door to top colleges, generous financial aid, and a national network of students with similar backgrounds and goals.

    However, students should approach QuestBridge carefully. The application takes time, the Match process has important rules, and ranking colleges should be done thoughtfully. Students should research each partner college, understand whether the Match is binding, and prepare materials early.

    For high-achieving students from low-income families, QuestBridge is absolutely worth considering as part of a strong college admissions strategy.

  • Top Computer Science Schools in the U.S. Based on CSRankings

    Top Computer Science Schools in the U.S. Based on CSRankings

    Computer Science Admissions

    Top Computer Science Schools in the U.S. Based on CSRankings

    For students interested in computer science, rankings can be helpful—but only when families understand what the ranking actually measures. This article summarizes the top U.S. computer science programs based on CSRankings.org, a research-focused ranking system that tracks faculty publications at selective computer science conferences.

    What Is CSRankings?

    CSRankings is a computer science ranking system that focuses on research output. Instead of ranking schools mainly by reputation, student surveys, or broad university prestige, CSRankings measures computer science departments based on faculty publications in selective conferences across areas such as artificial intelligence, systems, theory, security, databases, human-computer interaction, software engineering, and more.

    This makes CSRankings especially useful for students who are interested in research, graduate school, Ph.D. preparation, or understanding which universities have strong faculty activity in specific computer science fields.

    However, students should not use CSRankings as the only factor when choosing a college. Undergraduate teaching quality, internship access, cost, campus culture, career placement, location, class size, and academic fit still matter greatly.

    Why This Ranking Matters for CS Applicants

    Computer science has become one of the most competitive college majors in the United States. At many universities, admission to the computer science major is significantly harder than general admission to the university. A school that looks like a “target” overall may actually be a reach school for computer science.

    For high school students building a college list, this means they should think beyond brand name alone. Some public universities with very strong computer science departments may be just as competitive—or even more competitive—for CS than many private universities.

    Top U.S. Computer Science Schools Based on CSRankings

    The following table is based on the CSRankings U.S. computer science ranking data provided from CSRankings.org. Because some schools are tied, multiple universities may share the same rank.

    Rank University Country Score Faculty Count
    1 Carnegie Mellon University United States 20.2 182
    2 University of Illinois at Urbana-Champaign United States 16.3 125
    3 University of California, San Diego United States 14.7 132
    4 Georgia Institute of Technology United States 13.6 151
    5 Massachusetts Institute of Technology United States 10.9 103
    6 University of Michigan United States 10.8 105
    7 University of Washington United States 10.4 80
    8 University of California, Berkeley United States 10.2 84
    8 University of Maryland, College Park United States 10.2 97
    10 Cornell University United States 10.1 105
    11 Northeastern University United States 9.5 114
    12 Stanford University United States 9.4 61
    13 Purdue University United States 8.0 74
    14 New York University United States 7.6 90
    14 University of Texas at Austin United States 7.6 60
    16 University of Wisconsin–Madison United States 7.5 85
    17 Princeton University United States 7.1 66
    18 University of Pennsylvania United States 6.7 69
    19 Columbia University United States 6.5 58
    20 University of California, Los Angeles United States 6.3 49
    21 University of Southern California United States 6.2 65
    22 University of California, Irvine United States 5.8 77
    23 University of Massachusetts Amherst United States 5.7 64
    24 Stony Brook University United States 5.4 63
    25 Northwestern University United States 5.3 79
    25 University of Chicago United States 5.3 49
    27 University of Virginia United States 5.1 66
    28 Rutgers University United States 5.0 57
    28 University of California, Riverside United States 5.0 58
    30 Duke University United States 4.9 56
    30 University of Utah United States 4.9 70
    32 Pennsylvania State University United States 4.7 62
    33 George Mason University United States 4.6 52
    33 University of California, Santa Barbara United States 4.6 41
    35 Boston University United States 4.5 59
    35 Texas A&M University United States 4.5 60
    37 Harvard University United States 4.3 38
    37 North Carolina State University United States 4.3 60
    37 University of California, Santa Cruz United States 4.3 67
    37 Virginia Tech United States 4.3 75
    41 Arizona State University United States 4.2 68
    41 Johns Hopkins University United States 4.2 74
    41 University of Illinois at Chicago United States 4.2 56
    41 Yale University United States 4.2 42
    45 Rice University United States 4.1 39
    45 University of North Carolina United States 4.1 44
    47 Ohio State University United States 4.0 47
    48 University of California, Davis United States 3.9 54
    48 University at Buffalo United States 3.9 44
    48 University of Colorado Boulder United States 3.9 75
    48 University of Minnesota United States 3.9 52
    52 Brown University United States 3.8 41
    53 Oregon State University United States 3.5 41
    53 University of Central Florida United States 3.5 68
    55 Indiana University United States 3.0 64
    55 University of Texas at Dallas United States 3.0 42
    57 Rochester Institute of Technology United States 2.9 63
    58 Washington University in St. Louis United States 2.8 31
    59 University of Rochester United States 2.7 28
    59 University of Texas at Arlington United States 2.7 36
    61 University of Florida United States 2.6 34
    61 University of Notre Dame United States 2.6 33
    63 Michigan State University United States 2.5 31
    63 New Jersey Institute of Technology United States 2.5 38
    65 Dartmouth College United States 2.4 29
    65 University of Connecticut United States 2.4 31
    65 University of Pittsburgh United States 2.4 32
    68 College of William and Mary United States 2.3 26
    68 Florida State University United States 2.3 22
    68 Tufts University United States 2.3 37
    68 Vanderbilt University United States 2.3 39
    72 Binghamton University United States 2.2 25
    72 Clemson University United States 2.2 35
    72 Stevens Institute of Technology United States 2.2 28
    72 UNC Charlotte United States 2.2 49
    72 University of Delaware United States 2.2 29
    77 University of California, Merced United States 2.1 18
    77 University of Georgia United States 2.1 25
    77 University of South Florida United States 2.1 36
    77 Worcester Polytechnic Institute United States 2.1 25
    81 California Institute of Technology United States 2.0 26
    81 Emory University United States 2.0 23
    81 Iowa State University United States 2.0 29
    81 University of Arizona United States 2.0 22
    85 Tulane University United States 1.9 15
    86 Drexel University United States 1.8 20
    86 Florida International University United States 1.8 32
    86 Georgetown University United States 1.8 16
    86 Washington State University United States 1.8 24
    86 Wayne State University United States 1.8 14
    91 CUNY United States 1.7 39
    91 Rensselaer Polytechnic Institute United States 1.7 23
    91 TTI Chicago United States 1.7 14
    91 Temple University United States 1.7 16
    91 University of Maryland, Baltimore County United States 1.7 33
    91 University of Iowa United States 1.7 18
    91 University of Tennessee United States 1.7 23
    98 Augusta University United States 1.6 24
    98 Case Western Reserve University United States 1.6 17
    98 Colorado State University United States 1.6 22
    98 George Washington University United States 1.6 14
    98 Illinois Institute of Technology United States 1.6 15
    98 Lehigh University United States 1.6 14
    98 University of Houston United States 1.6 21
    98 University of Massachusetts Lowell United States 1.6 20
    98 University of Nebraska United States 1.6 18
    98 University of North Texas United States 1.6 24
    98 University of Oregon United States 1.6 18
    98 University of Texas at San Antonio United States 1.6 24

    How Students Should Use This List

    Students should use this ranking as a research tool, not as a final college list. A high CSRankings position can indicate strong faculty research output, but undergraduate experience can vary widely from school to school.

    For example, a student interested in artificial intelligence, cybersecurity, robotics, or systems should look deeper into each department’s strengths instead of relying only on the overall ranking. CSRankings allows users to filter by specific computer science subfields, which can be especially helpful for students who already know their area of interest.

    Important Takeaway for College Admissions

    Many of the universities on this list are extremely competitive for computer science. Schools such as Carnegie Mellon, MIT, Stanford, UC Berkeley, Georgia Tech, UIUC, Cornell, University of Washington, and UC San Diego should usually be treated as reach schools for most applicants applying to computer science.

    Even strong students with excellent grades, advanced math coursework, coding experience, and high SAT or ACT scores should build a balanced college list. A strong computer science list should include reach schools, realistic target schools, and likely schools where the student would still be happy to attend.

    Recommended College List Strategy for Computer Science Applicants

    Category Suggested Count Meaning
    High Reach 3–5 schools Extremely selective CS programs such as CMU, MIT, Stanford, UC Berkeley, Cornell, or top Ivy-level options.
    Reach 4–6 schools Highly competitive CS programs where admission is possible but not predictable.
    Target 4–6 schools Schools where the student’s academic profile is clearly above the typical admitted range for CS.
    Likely / Safety 3–4 schools Schools with stronger admission probability, reasonable cost, and a CS program the student would be happy to attend.

    Final Thoughts

    The CSRankings list is valuable because it highlights research strength across computer science departments. For students who want to pursue graduate school, research, or specialized fields within computer science, this can be an especially helpful starting point.

    But the best computer science school is not always the highest-ranked school. The right choice depends on academic fit, affordability, career goals, internship access, research opportunities, and the student’s ability to thrive in that environment.

    Families should use rankings as one piece of the decision-making process—not the entire strategy.

    Source: Ranking data adapted from CSRankings.org U.S. Computer Science Rankings.

  • 2024 Ranking: Top 100 Dental Schools

    2024 Ranking: Top 100 Dental Schools

    The following table organizes the 2024 dental school ranking list by rank, institution, location, and number of dental programs. Students should use this as a starting point for research and confirm program details directly with each school.

    RankSchoolLocationDental Programs1University of PennsylvaniaPhiladelphia, PA15 dental programs2Columbia University in the City of New YorkNew York City, NY10 dental programs3Tufts UniversityMedford, MA17 dental programs4New York UniversityNew York City, NY4 dental programs5University of Southern CaliforniaLos Angeles, CA17 dental programs6University of California Los AngelesLos Angeles, CA5 dental programs7University of Michigan Ann ArborAnn Arbor, MI11 dental programs8University of North CarolinaChapel Hill, NC5 dental programs9Boston UniversityBoston, MA27 dental programs10University of FloridaGainesville, FL4 dental programs11Texas A&M University College StationCollege Station, TX15 dental programs12University of PittsburghPittsburgh, PA13 dental programs13University of Washington SeattleSeattle, WA13 dental programs14Ohio State UniversityColumbus, OH5 dental programs15Rutgers University New BrunswickNew Brunswick, NJ12 dental programs16University of Minnesota Twin CitiesMinneapolis, MN16 dental programs17The University of Texas Health Science CenterSan Antonio, TX13 dental programs18University at BuffaloBuffalo, NY14 dental programs19Creighton UniversityOmaha, NE4 dental programs20The University of Texas Health Science CenterHouston, TX14 dental programs21University of Maryland BaltimoreBaltimore, MD9 dental programs22University of the PacificStockton, CA4 dental programs23Temple UniversityPhiladelphia, PA8 dental programs24Virginia Commonwealth UniversityRichmond, VA4 dental programs25University of IowaIowa City, IA16 dental programs26Touro UniversityNew York City, NY1 dental program27Loma Linda UniversityLoma Linda, CA14 dental programs28University of California San FranciscoSan Francisco, CA7 dental programs29Louisiana State University Health Sciences Center New OrleansNew Orleans, LA5 dental programs30University of Nebraska Medical CenterOmaha, NE8 dental programs31University of Illinois ChicagoChicago, IL9 dental programs32Nova Southeastern UniversityFort Lauderdale, FL10 dental programs33MCPHS UniversityBoston, MA4 dental programs34University of Oklahoma Health Sciences CenterOklahoma City, OK4 dental programs35University of LouisvilleLouisville, KY13 dental programs36University of Missouri Kansas CityKansas City, MO8 dental programs37Midwestern University Downers GroveDowners Grove, IL1 dental program38Indiana University Purdue University IndianapolisIndianapolis, IN10 dental programs39University of New EnglandBiddeford, ME3 dental programs40A.T. Still University of Health SciencesKirksville, MO2 dental programs41University of Colorado Denver Anschutz MedicalDenver, CO2 dental programs42Harvard UniversityCambridge, MA23 dental programs43Case Western Reserve UniversityCleveland, OH7 dental programs44University of RochesterRochester, NY9 dental programs45University of ConnecticutStorrs, CT2 dental programs46Stony Brook UniversityStony Brook, NY5 dental programs47Howard UniversityWashington, DC5 dental programs48Marquette UniversityMilwaukee, WI8 dental programs49University of Detroit MercyDetroit, MI9 dental programs50University of KentuckyLexington, KY2 dental programs51University of UtahSalt Lake City, UT2 dental programs52Lake Erie College of Osteopathic MedicineErie, PA1 dental program53Medical University of South CarolinaCharleston, SC3 dental programs54University of AlabamaBirmingham, AL3 dental programs55West Virginia UniversityMorgantown, WV4 dental programs56University of MississippiUniversity, MS2 dental programs57University of WyomingLaramie, WY1 dental program58Roseman University of Health SciencesHenderson, NV2 dental programs59Oregon Health & Science UniversityPortland, OR7 dental programs60University of Nevada Las VegasLas Vegas, NV8 dental programs61Minnesota State University MankatoMankato, MN2 dental programs62East Carolina UniversityGreenville, NC1 dental program63University of New MexicoAlbuquerque, NM2 dental programs64Midwestern University GlendaleGlendale, AZ1 dental program65Old Dominion UniversityNorfolk, VA2 dental programs66Southern Illinois University EdwardsvilleEdwardsville, IL4 dental programs67Metropolitan State UniversitySaint Paul, MN2 dental programs68Foothill CollegeLos Altos Hills, CA4 dental programs69Northwestern UniversityEvanston, IL2 dental programs70Lehigh UniversityBethlehem, PA1 dental program71Clemson UniversityClemson, SC1 dental program72Rollins CollegeWinter Park, FL1 dental program73Saint Louis UniversitySaint Louis, MO5 dental programs74University of DaytonDayton, OH1 dental program75The University of Tennessee Health Science CenterMemphis, TN3 dental programs76University of New HavenWest Haven, CT2 dental programs77Regis CollegeWeston, MA2 dental programs78Pacific UniversityForest Grove, OR1 dental program79University of HawaiiHonolulu, HI1 dental program80Mayo Clinic College of Medicine and ScienceRochester, MN2 dental programs81Ferris State UniversityBig Rapids, MI2 dental programs82University of South DakotaVermillion, SD2 dental programs83Baker CollegeOwosso, MI1 dental program84University of Alaska AnchorageAnchorage, AK3 dental programs85University of ToledoToledo, OH1 dental program86Lincoln Memorial UniversityHarrogate, TN2 dental programs87Western University of Health SciencesPomona, CA1 dental program88Augusta UniversityAugusta, GA4 dental programs89Texas Woman’s UniversityDenton, TX1 dental program90Northern Arizona UniversityFlagstaff, AZ1 dental program91Jacksonville UniversityJacksonville, FL2 dental programs92University of LouisianaMonroe, LA1 dental program93Youngstown State UniversityYoungstown, OH1 dental program94Seton Hill UniversityGreensburg, PA3 dental programs95University of Arkansas for Medical SciencesLittle Rock, AR1 dental program96Idaho State UniversityPocatello, ID3 dental programs97Wichita State UniversityWichita, KS1 dental program98Eastern Washington UniversityCheney, WA2 dental programs99Western Kentucky UniversityBowling Green, KY2 dental programs100East Tennessee State UniversityJohnson City, TN1 dental program

    Rankings and program counts can change over time. Students interested in BS/DMD, BS/DDS, pre-dental, or direct dental pathways should verify current admissions requirements, program availability, and eligibility rules directly with each institution.

  • BS/DMD Programs: What High School Students Should Know Before Applying

    BS/DMD Programs: What High School Students Should Know Before Applying

    For students who are serious about becoming dentists, BS/DMD programs can be one of the most direct — and competitive — pathways into dental school.

    A BS/DMD program is a combined undergraduate and dental school pathway that allows students to pursue a bachelor’s degree and a Doctor of Dental Medicine degree through a structured admissions track. In many cases, students apply while they are still in high school and, if accepted, receive a conditional pathway into dental school after completing specific undergraduate requirements.

    These programs are especially attractive to students who already have a strong interest in dentistry, healthcare, science, patient care, and long-term professional school planning. However, they are also highly selective, and families should understand that applying to BS/DMD programs is not the same as applying to a regular biology or pre-health major.

    What Does BS/DMD Mean?

    BS/DMD stands for Bachelor of Science / Doctor of Dental Medicine. Some schools may use similar names such as BS/DDS, BA/DMD, or accelerated dental programs. The general idea is similar: students complete an undergraduate degree and then continue into dental school, often through a partner dental school or an affiliated dental program.

    Traditional dental preparation usually involves four years of undergraduate study followed by four years of dental school. Some combined programs may shorten the overall timeline to seven years, while others may keep the traditional eight-year timeline but provide a more direct or conditionally guaranteed pathway.

    Why BS/DMD Programs Are So Competitive

    BS/DMD programs are competitive because they are not simply evaluating whether a student can succeed in college. They are also asking whether a high school student has the maturity, academic strength, service mindset, and professional clarity to eventually succeed in dental school.

    Strong applicants usually need more than a high GPA. Competitive students often show evidence of:

    • Advanced science coursework, especially biology and chemistry
    • Strong standardized test scores, when required or submitted
    • Dental shadowing or healthcare-related exposure
    • Community service and patient-centered activities
    • Leadership experience
    • Clear motivation for dentistry
    • Strong communication skills
    • A thoughtful explanation of why dentistry is the right career path

    This is why BS/DMD admissions should be treated as a specialized application strategy, not simply an extra box to check on the college list.

    Common Requirements for BS/DMD Applicants

    Each program has its own requirements, so students should always check the official admissions page for each school. However, many BS/DMD and accelerated dental programs may consider some combination of the following:

    • High school transcript
    • Rigorous coursework, including honors, AP, IB, or dual-enrollment science classes
    • SAT or ACT scores, depending on the program’s testing policy
    • Supplemental essays
    • Dental or healthcare experience
    • Letters of recommendation
    • Interview performance
    • Minimum college GPA requirements after enrollment
    • DAT requirements for continuation, depending on the program

    Students should also understand that acceptance into a BS/DMD program is often conditional. A student may need to maintain a specific GPA, complete prerequisite courses, demonstrate professionalism, and satisfy additional program requirements before officially entering dental school.

    Important Dental School Prerequisites to Know Early

    Even for students applying to combined dental pathways, the academic foundation matters. Dental schools commonly expect strong preparation in biology, general chemistry, organic chemistry, physics, and related lab sciences. Students who are serious about dentistry should begin planning their high school and college coursework early.

    At the college level, many dental schools traditionally expect coursework such as:

    • Biology with lab
    • General chemistry with lab
    • Organic chemistry with lab
    • Physics with lab
    • English or writing-intensive coursework
    • Additional recommended courses such as biochemistry, anatomy, physiology, microbiology, or upper-level sciences

    For high school students, this means the preparation starts long before the dental school application. Course selection, summer planning, volunteering, shadowing, and essay development should all support the same long-term story.

    What Makes a Strong BS/DMD Essay?

    A strong BS/DMD essay should not sound like a generic “I want to help people” essay. Admissions readers want to understand why the student is specifically interested in dentistry.

    Strong essays often include:

    • A specific moment that sparked the student’s interest in dentistry
    • Evidence that the student understands the profession
    • Reflection from shadowing, volunteering, research, or patient-facing experience
    • A connection between science, service, communication, and manual skill
    • A mature explanation of long-term goals

    The best essays do not simply praise dentistry. They show that the student has explored the field carefully and understands both the rewards and responsibilities of the profession.

    BS/DMD Strategy: Building the Right College List

    Families should be careful not to build a college list only around BS/DMD programs. Because these programs are extremely selective, students should also apply to strong undergraduate colleges where they can succeed as pre-dental students even if they are not admitted to a direct dental pathway.

    A balanced college list may include:

    Category Purpose
    BS/DMD or BS/DDS Programs Highly selective direct or accelerated dental pathways
    Strong Pre-Dental Colleges Schools with strong science advising, research, and healthcare opportunities
    Target Schools Colleges where the student’s academic profile is competitive
    Likely/Safety Schools Schools with strong admission probability, affordability, and pre-health support

    The goal is not just to get into one program. The goal is to preserve multiple strong pathways toward dental school.

    Common Mistakes Students Make When Applying to BS/DMD Programs

    Many strong students hurt their chances by approaching BS/DMD applications too casually. Common mistakes include:

    • Starting dental shadowing too late
    • Writing essays that sound too general
    • Applying without understanding each program’s continuation requirements
    • Assuming high grades alone are enough
    • Not preparing for interviews
    • Building a college list with too many reach programs and not enough realistic options
    • Failing to explain why dentistry, not just medicine or healthcare generally, is the right fit

    BS/DMD admissions require early planning because the application must show consistency. A student’s classes, activities, essays, recommendations, and interview should all support the same professional direction.

    Examples of BS/DMD, BS/DDS, and Direct Dental Programs

    The following list includes examples of BS/DMD, BS/DDS, early assurance, guaranteed admission, conditional admission, and accelerated dental pathways. Program details can change, so students should always confirm the most current requirements directly with each college or dental school before applying.

    Programs Commonly Open to High School Applicants

    Dental School / Program Program Type General Structure Notes
    Augusta University / Dental College of Georgia BS/DMD pathway 7-year program Typically structured as 3 years of undergraduate study followed by 4 years of dental school.
    Case Western Reserve University School of Dental Medicine Guaranteed admission / articulation pathway 6-year, 7-year, and 8-year options may be available Includes pre-professional or articulation-style pathways with select undergraduate partners.
    Howard University College of Dentistry Combined education program 6-year pathway Often described as a 2+4 combined curriculum with conditional acceptance into the dental pathway.
    Marquette University School of Dentistry Pre-Dental Scholars Program 7-year pathway Conditional acceptance pathway for qualified students.
    Missouri Southern State University / Kansas City University Early acceptance program 7-year pathway Generally structured as 3 years at MSSU followed by 4 years at Kansas City University.
    LECOM School of Dental Medicine Early acceptance program 8-year pathway Partner undergraduate schools may include institutions such as Gannon University, Adelphi University, and Wisconsin Lutheran College.
    Nova Southeastern University Dual admission dental program 7-year or 8-year pathway Direct or dual admission style program for qualified applicants.
    New York University College of Dentistry Guaranteed admission pathway 7-year pathway May include pathways through NYU College of Arts and Science and partner institutions.
    Rutgers School of Dental Medicine Articulation agreements Often 7-year pathways Rutgers has had articulation agreements with multiple undergraduate colleges. Students should check each undergraduate partner for details.
    Stony Brook University School of Dental Medicine Scholars for Dental Medicine 8-year conditional program Designed for Stony Brook undergraduate students pursuing a conditional dental pathway.
    Temple University Kornberg School of Dentistry Conditional dental pathway 7-year pathway May include pathways with Penn State Erie, The Behrend College, and Temple University College of Science and Technology.
    University of Connecticut Special Program in Dental Medicine Special program in dental medicine 8-year conditional pathway Highly selective pathway for students interested in dental medicine.
    University of Detroit Mercy School of Dentistry Conditional dental program 7-year pathway Program may be connected to the McNichols Campus undergraduate pathway.
    University of Illinois Chicago College of Dentistry Conditional acceptance pathway 8-year pathway Admission or continuation may depend on undergraduate performance and program requirements.
    University of Louisville School of Dentistry ULEAD program 8-year conditional pathway Designed for University of Louisville students pursuing a dental school pathway.
    University of Nevada, Reno / University of Nevada, Las Vegas Conditional dental pathway 7-year pathway May be limited to Nevada high school graduates admitted to the University of Nevada, Reno.
    University of the Pacific Arthur A. Dugoni School of Dentistry Accelerated dental pathway 5-year, 6-year, or 7-year options Undergraduate study is generally completed at the Stockton campus, followed by dental study in San Francisco.
    University of Pittsburgh School of Dental Medicine Guaranteed admission program 8-year pathway Direct or guaranteed admission style dental medicine pathway for qualified students.
    University of Pennsylvania School of Dental Medicine Biodental program 7-year conditional pathway May include pathways with the University of Pennsylvania College of Arts and Sciences and select partner institutions such as Hampton University, Lehigh University, Muhlenberg College, and Villanova University.
    Virginia Commonwealth University School of Dentistry Guaranteed admission program 8-year pathway Dental school pathway for qualified students who meet continuation requirements.

    Programs Commonly Open to Current College Students

    Dental School / Program Program Type When Students Apply Notes
    Boston University Henry M. Goldman School of Dental Medicine MMEDIC program After approximately 2 years of study at Boston University Modular Medical/Dental Integrated Curriculum pathway for qualified BU students.
    Southern Illinois University School of Dental Medicine Accelerated dental pathway During undergraduate study May be connected to Southern Illinois University Edwardsville and may have Illinois residency requirements.
    Tufts University School of Dental Medicine Early assurance program As a Tufts college sophomore Early assurance pathway for qualified Tufts undergraduate students.
    University of Missouri-Kansas City School of Dentistry DDS Reserved Admission Program Sophomore year May be limited to Missouri or Kansas residents.
    University of Florida College of Dentistry Honors combined BS/DMD program Second semester freshman year 7-year combined pathway for qualified University of Florida students.
    Virginia Commonwealth University School of Dentistry Preferred Applicant Track During undergraduate study at VCU Designed for qualified VCU Honors College students who entered as freshmen.

    Because program names, partner schools, eligibility rules, and application timelines can change, students should treat this table as a starting point for research. Before applying, confirm whether the program is open to high school seniors, current college students, state residents, honors students, or students at specific partner institutions.

    How MMT Prep Helps BS/DMD Applicants

    MMT Prep helps students build a clear and competitive BS/DMD admissions strategy. We work with students on academic planning, activity development, essay strategy, interview preparation, and college list building.

    Our goal is to help students present a mature, well-supported application that explains not only that they are strong students, but also why they are ready to pursue dentistry as a long-term professional path.

    For BS/DMD applicants, we can help with:

    • College list strategy
    • BS/DMD and BS/DDS program research
    • Personal statement and supplemental essay planning
    • Dental experience and activity positioning
    • Interview preparation
    • Pre-dental academic roadmap planning
    • Application timeline management

    Final Takeaway

    BS/DMD programs can be an excellent opportunity for students who are deeply committed to dentistry, but they require thoughtful preparation. These programs are not simply looking for students who are good at science. They are looking for students who can demonstrate academic readiness, professional maturity, service orientation, and a clear understanding of the dental field.

    Students who begin early, build meaningful dental-related experiences, and develop a balanced college strategy will be in a much stronger position.

    If your student is interested in BS/DMD, BS/DDS, or other direct dental pathways, MMT Prep can help you create a focused admissions plan.

    Contact MMT Prep at seank@mmtprep.com to learn more.

  • Reach Schools vs Target Schools: Why Top Colleges Are More Competitive Than Families Think

    Reach Schools vs Target Schools: Why Top Colleges Are More Competitive Than Families Think

    College Admissions Strategy

    Many families underestimate how competitive today’s college admissions landscape has become. Schools that once felt like realistic “target schools” are now often lottery-level reach schools, even for students with strong GPAs, high SAT scores, and impressive extracurriculars.

    The “Reach School” Category Is Bigger Than Most Families Realize

    In college admissions, a reach school is not simply a school where the student is slightly below average. Today, many highly selective universities and liberal arts colleges should be treated as reaches for nearly every applicant.

    Even a student with excellent grades, rigorous coursework, strong test scores, and meaningful extracurricular activities may not be able to predict admission at schools with single-digit acceptance rates.

    The biggest mistake families make is assuming that a strong student automatically has “target school” odds at elite colleges. In reality, many of these schools are reaches because the number of qualified applicants far exceeds the number of available seats.

    Examples of Highly Competitive Reach Schools

    The following schools have extremely low admission rates. For most students, these colleges should be categorized as high reach or reach schools, not targets.

    SchoolAdmission RateColumbia4%Vanderbilt4%Yale4%Duke5%MIT5%Brown5%Dartmouth6%Amherst7%Bowdoin7%Northwestern7%Williams7%Rice8%Notre Dame9%Georgia Tech Non-Resident9%UVA Non-Resident10%USC12%Boston College13%

    A strong GPA and high SAT or ACT score are no longer enough to make these schools “targets.” For most high-achieving students, these colleges should be treated as reach schools because admission is highly unpredictable.

    What Is the Difference Between a Reach, Target, and Safety School?

    A balanced college list should include several types of schools. The goal is not just to apply to impressive names. The goal is to make sure the student has strong options when admission decisions arrive.

    CategorySuggested CountMeaningHigh Reach3–5Ivy League schools, Stanford-like schools, MIT, Duke, Vanderbilt, and top liberal arts collegesReach4–6Schools such as USC, Boston College, Notre Dame, Rice, and top public universities for non-residentsTarget4–6Schools where the student’s academic profile is clearly above the admitted student averageLikely or Safety3–4Schools with strong admission probability, realistic affordability, and programs the student would be happy to attend

    This kind of structure helps students avoid overloading their list with unpredictable schools. A good college list should balance ambition with realistic admissions outcomes.

    The Common College List Mistake: Prestige Stacking

    Many families build a college list that looks impressive but is not strategically balanced. For example, a list like this may look strong on paper:

    Columbia, Yale, Duke, USC, NYU, UCLA, UC Berkeley, Northwestern, and Vanderbilt

    The problem is that this list is almost entirely made up of reach schools. Even if the student is academically qualified, the list does not provide enough realistic admission options.

    This is why families should not build a college list based only on rankings, brand names, or prestige. A strong college application strategy should be based on admission probability, academic fit, financial fit, major competitiveness, and the student’s long-term goals.

    Public Universities Are Not Automatically Safety Schools

    Another important misunderstanding is that public universities are automatically safer than private universities. This is especially untrue for popular public universities with massive applicant pools.

    The University of California system is a clear example. Several UC campuses receive enormous numbers of applications each year.

    UC SchoolApplicantsUCLA146,672UC San Diego141,752UC Berkeley133,128UC Irvine125,987UC Santa Barbara108,503UC Davis104,850

    Even without looking at admission rates, the applicant volume alone shows how competitive these schools can be. For out-of-state students and students applying to impacted majors such as computer science, engineering, biology, business, data science, or nursing, these universities can become reach schools very quickly.

    A student should not assume:

    “I’ll apply to UC schools as backups.”

    For many students, UCLA, UC Berkeley, UC San Diego, and UC Irvine are not backup schools. They are reach schools.

    How Students Should Build a Balanced College List

    The modern college list should be built around risk management, not prestige stacking. Students should apply broadly, but they should also classify schools more conservatively.

    A high-achieving student may be qualified for top schools, but qualification does not equal predictability. This is one of the most important points families need to understand.

    A student can be academically strong and still face very low odds at schools with acceptance rates below 10%. That does not mean the student is not impressive. It simply means the admissions process at highly selective colleges has become extremely competitive.

    College Counseling Takeaway for Families

    For families going through the college admissions process, the most important strategy is to create a list that gives the student real choices in April.

    A counselor might explain it this way:

    “Your student may be qualified for top schools, but qualification does not equal predictability. The goal is not just to apply to famous colleges. The goal is to create a list where the student has real options in April.”

    The most meaningful takeaway from this data is simple:

    Apply broadly, classify schools more conservatively, and make sure the student has at least 3–4 schools they would genuinely be happy to attend where admission is realistically likely.

    Final Thoughts: A Smart College List Creates Options

    A balanced college list does not mean giving up on dream schools. Students should still apply to ambitious reach schools when those schools are a strong fit.

    However, a successful college admissions strategy also requires realistic planning. The best college list includes reach schools, target schools, and likely schools that the student would truly be excited to attend.

    In today’s admissions environment, the smartest families are not just asking, “Where is the most prestigious place my student can apply?” They are asking, “Where can my student thrive, get admitted, and have strong options when decisions come out?”

  • Why MMT Prep is Popping in Beaverton Right Now

    Why MMT Prep is Popping in Beaverton Right Now

    So, What’s the Big Deal About Beaverton?

    Are you wondering why Beaverton is suddenly the go-to spot for students looking to boost their test scores and academic skills? You’re not alone – it seems like every other parent in the Portland area is talking about the same thing: finding the best tutoring center in Beaverton to help their child succeed.

    As a parent, you want the best for your child, and that includes giving them every opportunity to excel in school and beyond. But let’s be real – the education system can be tough, and sometimes your child needs a little extra help to stay on top of their game. That’s where MMT Prep comes in – a tutoring center in Beaverton that’s quickly becoming the top choice for students and parents alike.

    What Sets MMT Prep Apart

    So, what makes MMT Prep the best tutoring center in Beaverton? For starters, their team of expert tutors are dedicated to helping your child achieve their full potential, whether that’s acing the SAT or mastering a difficult math concept. They offer personalized test prep in Oregon, tailored to your child’s unique needs and learning style, and they’re always available to answer your questions and concerns.

    But MMT Prep is more than just a tutoring center – it’s a community. Their Beaverton tutoring center is a welcoming and supportive environment where your child can feel comfortable asking questions and seeking help. And with their Oregon tutoring services, you can trust that your child is in good hands, whether they’re looking for test prep, homework help, or just some extra guidance and support.

    Why Beaverton?

    So, why Beaverton? Well, for one thing, it’s a great location – close to Portland, Hillsboro, and Bethany, making it easy for students from all over the Portland area to get to. And with its strong schools and family-friendly vibe, Beaverton is the perfect place for a tutoring center like MMT Prep to thrive. Plus, with the growing demand for test prep in Oregon, it’s no surprise that MMT Prep is popping in Beaverton right now.

    But don’t just take our word for it – check out the MMTPrep Beaverton reviews from satisfied parents and students who’ve seen real results from their tutoring sessions. And if you’re looking for the best test prep centers in Oregon, look no further than MMT Prep – their Beaverton tutoring center is the perfect place to start your child’s journey to academic success.

    What’s Next?

    So, what are you waiting for? If you’re looking for a tutoring center in Beaverton that can help your child achieve their full potential, look no further than MMT Prep. With their expert tutors, personalized test prep, and supportive community, you can trust that your child is in good hands. And with their Portland area tutoring services, you can be sure that your child will get the help they need to succeed – no matter where they are in their academic journey, and they’ll be able to get the scores they need, and you’ll be able to relax, knowing your child is getting the best possible education, and that’s a pretty great feeling, right?

    Ready to get started? Contact MMT Prep today to learn more about their Beaverton tutoring center and how they can help your child achieve their academic goals. With MMT Prep, you can trust that your child will get the best possible education, and that’s something to feel good about.