Class of 2030 Admit Rates
Overall admission rates for the class of 2030 are updated once information become available. Check back for updates as colleges continue to release data!
| School |
Class of 2030 |
Class of 2029 |
Class of 2028 |
Class of 2027 |
| Adelphi University |
TBA |
72.15% |
65.90% |
77.53% |
| American University |
TBA |
65.56% |
61.87% |
47.38% |
| Amherst College |
6.78% |
7.72% |
9.01% |
9.81% |
| Arizona State University |
TBA |
Overall: 88.39%
In-state: 90.00%
Out-of-state: 87.24%
International: 89.93% |
Overall: 89.89%
In-state: 91.62%
Out-of-state: 89.17%
International: 89.63% |
Overall: 90.19%
In-state: 92.00%
Out-of-state: 89.74%
International: 88.38% |
| Auburn University |
TBA |
46.89% |
45.92% |
50.47% |
| Babson College |
TBA |
16.00% |
17.09% |
19.74% |
| Barnard College |
TBA |
10.05% |
8.84% |
7.96% |
| Bates College |
TBA |
14.83% |
13.30% |
13.06% |
| Baylor University |
TBA |
52.22% |
51.28% |
50.97% |
| Belmont University |
TBA |
93.67% |
95.28% |
96.36% |
| Bentley University |
TBA |
TBA |
45.05% |
48.44%.pdf) |
| Binghamton University |
TBA |
Overall: 37.31%
In-state: 29.10%
Out-of-state: 73.73%
International: 62.06% |
Overall: 38.61%
In-state: 31.32%
Out-of-state: 79.18%
International: 65.44% |
Overall: 37.73%
In-state: 31.45%
Out-of-state: 75.16%
International: 60.98% |
| Boston College |
12.70% |
13.85% |
16.19% |
15.65% |
| Boston University |
TBA |
12.83% |
11.11% |
10.85% |
| Bowdoin College |
6.53% |
6.81% |
7.13% |
8.02% |
| Brandeis University |
TBA |
45.00% |
40.47% |
35.33% |
| Brown University |
5.35% |
5.65% |
5.39% |
5.23% |
| Bryn Mawr College |
TBA |
28.15% |
29.43% |
31.06% |
| Bucknell University |
TBA |
32.20% |
28.93% |
32.01% |
| California Institute of Technology |
TBA |
3.78% |
2.57% |
3.14% |
| California Polytechnic State University, San Luis Obispo |
TBA |
Overall: 29.96%
In-state: 26.36%
Out-of-state: 62.08%
International: 31.03% |
Overall: 31.22%
In-state: 28.85%
Out-of-state: 53.56%
International: 30.83% |
Overall: 29.65%
In-state: 28.24%
Out-of-state: 41.43%
International: 34.69% |
| Carleton College |
TBA |
21.78% |
20.41% |
22.28% |
| Carnegie Mellon University |
TBA |
11.07% |
11.66% |
11.40% |
| Case Western Reserve University |
TBA |
35.31% |
37.78% |
28.68% |
| Chapman University |
TBA |
72.06% |
65.43% |
55.61% |
| Claremont McKenna College |
TBA |
9.44% |
9.59% |
11.12% |
| Clark University |
TBA |
40.47% |
39.54% |
41.67% |
| Clemson University |
TBA |
Overall: 42.43%
In-state: 52.89%
Out-of-state and international: 40.36% |
Overall: 38.34%
In-state: 55.95%
Out-of-state: 34.94%
International: 35.77% |
Overall: 38.05%
In-state: 49.23%
Out-of-state: 36.04%
International: 19.64% |
| Colby College |
TBA |
8.00% |
7.09% |
6.83% |
| Colgate University |
TBA |
17.43% |
13.88% |
11.95% |
| College of Charleston |
TBA |
Overall: 73.00%
In-state: 72.52%
Out-of-state: 73.53%
International: 47.68% |
Overall: 60.03%
In-state: 73.94%
Out-of-state: 55.76%
International: 54.44% |
Overall: 72.00%
In-state: 75.61%
Out-of-state: 70.92%
International: 49.06% |
| College of the Holy Cross |
TBA |
17.00% |
18.00% |
21.10% |
| Colorado College |
TBA |
22.09% |
18.47% |
20.03% |
| Columbia University |
4.23% |
4.94% |
3.86% |
4.00% |
| Connecticut College |
TBA |
39.18% |
37.04% |
38.28% |
| Cornell University |
TBA |
8.38% |
8.41% |
7.90% |
| Dartmouth College |
5.84% |
6.02% |
5.40% |
6.23% |
| Davidson College |
TBA |
12.62% |
13.37% |
14.48% |
| Denison University |
~22.00% |
19.55% |
17.39% |
16.93% |
| DePaul University |
TBA |
87.80% |
75.89% |
73.53% |
| Dickinson College |
TBA |
41.49% |
42.09% |
43.08% |
| Drexel University |
TBA |
69.90% |
79.44% |
77.53% |
| Duke University |
4.73% |
5.20% |
5.71% |
6.78% |
| Elon University |
TBA |
63.26% |
66.35% |
67.31% |
| Emory University |
Overall: 12.29% |
Emory: 10.30%
Oxford: 13.34% |
Emory: 10.29%
Oxford: 12.66% |
Emory: 10.65%
Oxford: 16.51% |
| Fairfield University |
21.00% |
25.05% |
33.29% |
44.98% |
| Fashion Institute of Technology |
TBA |
Overall: 67.01%
In-state: 69.60%
Out-of-state: 65.08%
International: 64.38% |
Overall: 60.24%
In-state: 65.52%
Out-of-state: 57.48%
International: 51.88% |
Overall: 57.61%
In-state: 59.59%
Out-of-state: 56.97%
International: 53.61% |
| Florida State University |
Overall: ~20.11% |
Overall: 23.83%
In-state: 34.05%
Out-of-state: 13.53%
International: 7.88% |
Overall: 24.22%
In-state: 31.85%
Out-of-state: 16.58%
International: 10.55% |
Overall: 25.38%
In-state: 36.14%
Out-of-state: 14.42%
International: 8.09% |
| Fordham University |
~47.00% |
57.76% |
59.29% |
56.28% |
| Franklin & Marshall College |
TBA |
31.63% |
28.19% |
31.83% |
| Furman University |
TBA |
47.98% |
42.95% |
52.57% |
| George Washington University |
TBA |
TBA |
47.09% |
43.54% |
| Georgetown University |
13.00% |
13.49% |
12.91% |
13.08% |
| Georgia Tech |
Overall: 12.82%
In-state: ~27.64%
Out-of-state and international: ~9.28% |
Overall: 13.34%
In-state: 29.46%
Out-of-state: 10.12%
International: 7.34% |
Overall: 14.07%
In-state: 33.13%
Out-of-state: 10.42%
International: 8.20% |
Overall: 16.46%
In-state: 36.60%
Out-of-state: 12.53%
International: 9.95% |
| Gonzaga University |
TBA |
79.62% |
81.69% |
75.96% |
| Grinnell College |
TBA |
16.00% |
14.51% |
12.68% |
| Hamilton College |
TBA |
13.59% |
13.62% |
11.77% |
| Harvard University |
TBA |
4.18% |
3.65% |
3.45% |
| Harvey Mudd College |
TBA |
12.33% |
12.66% |
13.10% |
| Haverford College |
TBA |
13.31% |
12.37% |
12.91% |
| Howard University |
TBA |
TBA |
41.34% |
34.89% |
| Hunter College |
TBA |
TBA |
53.80% |
54.05% |
| Indiana University – Bloomington |
TBA |
Overall: 75.89%
In-state: 72.24%
Out-of-state: 78.58%
International: 63.61% |
Overall: 78.21%
In-state: 75.14%
Out-of-state: 80.76%
International: 66.82% |
Overall: 80.37%
In-state: 75.79%
Out-of-state: 83.91%
International: 70.64% |
| Johns Hopkins University |
TBA |
6.11% |
6.44% |
7.56% |
| Kenyon College |
TBA |
TBA |
31.03% |
30.71% |
| Lafayette College |
32.27% |
31.16% |
31.45% |
31.40% |
| Lehigh University |
TBA |
28.96% |
25.93% |
29.26% |
| Lewis & Clark College |
TBA |
71.18% |
78.49% |
74.53% |
| Loyola Marymount University |
TBA |
48.21% |
45.08% |
40.29% |
| Loyola University Chicago |
TBA |
75.10% |
81.60% |
81.39% |
| Loyola University Maryland |
TBA |
69.86% |
75.49% |
76.33% |
| Macalester College |
TBA |
28.13% |
28.52% |
28.21% |
| Marquette University |
TBA |
78.02% |
81.34% |
87.48% |
| Massachusetts Institute of Technology |
4.58% |
4.56% |
4.55% |
4.80% |
| Miami University – Ohio |
TBA |
70.41% |
Overall: 75.40%
In-state: 80.42%
Out-of-state: 83.49%
International: 33.98% |
83.35% |
| Michigan State University |
TBA |
81.27% |
Overall: 84.80%
In-state: 84.36%
Out-of-state: 84.37%
International: 88.10% |
87.05% |
| Middlebury College |
Fall 2026 and spring 2027 admits: ~17.00% |
Fall 2025 admits only: 12.77%
Fall 2025 and spring 2026 admits: ~13.90% |
Fall 2024 admits only: 10.75%
Fall 2024 and spring 2025 admits: 11.96% |
Fall 2023 admits only: 10.37%
Fall 2023 and spring 2024 admits: ~11.00% |
| Montana State University |
TBA |
Overall: 99.38% |
Overall: 82.14%
In-state: 86.21%
Out-of-state: 80.99%
International: 91.78% |
Overall: 86.83%
In-state: 84.93%
Out-of-state: 87.29%
International: 98.67% |
| Mount Holyoke College |
TBA |
TBA |
36.00% |
38.00% |
| Muhlenberg College |
TBA |
TBA |
71.99% |
64.01% |
| New York University |
TBA |
9.06%%20for%20the%20web.pdf) |
9.23% |
9.41% |
| North Carolina State University |
TBA |
Overall: 39.53%
In-state: 46.22%
Out-of-state: 25.17%
International: 34.36% |
Overall: 41.67%
In-state: 49.56%
Out-of-state: 35.71%
International: 22.87% |
Overall: 39.55%
In-state: 49.98%
Out-of-state: 28.67%
International: 28.45% |
| Northeastern University |
TBA |
5.62% |
5.22% |
5.65% |
| Northwestern University |
~7.00% |
~7.00% |
7.69% |
7.22% |
| Oberlin College |
TBA |
College of Arts and Sciences: 34.02%
Conservatory of Music: 26.11% |
Overall: 34.16%
College of Arts and Sciences: 34.30%
Conservatory of Music: 33.09% |
Overall: 32.98%
College of Arts and Sciences: 32.92%
Conservatory of Music: 34.68% |
| Occidental College |
TBA |
44.85% |
44.17% |
39.89% |
| Ohio State University |
TBA |
Overall: 49.20%
In-state: 45.09%
Out-of-state: 46.42%
International: 66.09% |
Overall: 60.57%
In-state: 57.31%
Out-of-state: 58.98%
International: 72.03% |
Overall: 50.82%
In-state: 49.13%
Out-of-state: 49.73%
International: 57.26% |
| Olin College of Engineering |
TBA |
TBA |
25.20% |
21.66% |
| Pace University |
TBA |
78.47% |
75.92% |
77.14% |
| Pennsylvania State University |
TBA |
TBA |
Overall: 60.56%
In-state: 62.51%
Out-of-state: 59.08%
International: 64.37% |
Overall: 54.22%
In-state: 57.86%
Out-of-state: 53.12%
International: 53.37% |
| Pepperdine University |
TBA |
67.36% |
62.86% |
49.85% |
| Pitzer College |
TBA |
26.80% |
25.16% |
16.66% |
| Pomona College |
TBA |
7.14% |
7.09% |
6.76% |
| Princeton University |
TBA |
4.42% |
4.62% |
4.50% |
| Providence College |
TBA |
49.90% |
50.89% |
48.58% |
| Purdue University |
TBA |
Overall: 43.43%
In-state: 71.09%
Out-of-state: 43.58%
International: 22.49% |
Overall: 49.79%
In-state: 74.17%
Out-of-state: 50.70%
International: 27.56% |
Overall: 50.36%
In-state: 73.99%
Out-of-state: 50.40%
International: 29.78% |
| Reed College |
TBA |
29.19% |
24.61% |
27.16% |
| Rensselaer Polytechnic Institute |
TBA |
67.25% |
63.43% |
58.50% |
| Rhode Island School of Design |
TBA |
23.38% |
18.66% |
13.81% |
| Rice University |
7.73% |
8.01% |
8.00% |
7.88% |
| Rochester Institute of Technology |
TBA |
TBA |
66.98% |
71.14% |
| Rose-Hulman Institute of Technology |
TBA |
79.29% |
76.86% |
72.81% |
| Rutgers University–New Brunswick |
TBA |
TBA |
Overall: 59.73% |
Overall: 65.35%
In-state: 70.72%
Out-of-state: 71.98%
International: 62.27% |
| Sacred Heart University |
TBA |
TBA |
65.36% |
67.68% |
| San Diego State University |
TBA |
Overall: 37.41%
In-state: 31.32%
Out-of-state: 90.70%
International: 59.02% |
Overall: 35.98%
In-state: 30.79%
Out-of-state: 87.06%
International: 57.06% |
Overall: 34.18%
In-state: 29.34%
Out-of-state: 81.08%
International: 50.12% |
| Santa Clara University |
TBA |
47.88% |
48.00% |
43.84% |
| Sarah Lawrence College |
TBA |
TBA |
61.73% |
58.93% |
| Savannah College of Art and Design |
TBA |
74.94% |
82.98% |
83.68% |
| Scripps College |
TBA |
39.88% |
38.29% |
33.94% |
| Seattle University |
TBA |
TBA |
76.92% |
76.05% |
| Seton Hall University |
TBA |
69.00% |
73.26% |
78.90% |
| Skidmore College |
TBA |
23.77% |
21.05% |
22.92% |
| Smith College |
TBA |
22.41% |
21.00% |
19.73% |
| Southern Methodist University |
TBA |
47.64% |
63.35% |
61.22% |
| Stanford University |
TBA |
3.80% |
3.61% |
3.91% |
| Stony Brook University |
TBA |
Overall: 48.18%
In-state: 39.95%
Out-of-state: 62.91%
International: 67.09% |
Overall: 49.04%
In-state: 41.57%
Out-of-state: 61.68%
International: 73.08% |
Overall: 49.01%
In-state: 42.75%
Out-of-state: 60.60%
International: 71.40% |
| Swarthmore College |
7.44% |
7.52% |
7.46% |
6.94% |
| Syracuse University |
TBA |
TBA |
45.92% |
43.12% |
| Texas A\&M |
TBA |
Overall: 51.66%
In-state: 54.15%
Out-of-state: 41.25%
International: 48.55% |
Overall: 57.32% In-state: 59.02% Out-of-state: 48.71% International: 56.53% |
Overall: 63.10%
In-state: 65.05%
Out-of-state: 52.74%
International: 63.50% |
| Texas Christian University |
TBA |
48.09% |
44.49% |
42.60% |
| Texas Tech |
TBA |
Overall: 69.04% |
Overall: 72.65%
In-state: 74.82%
Out-of-state: 68.25%
International: 33.65% |
Overall: 70.89%
In-state: 72.30%
Out-of-state: 68.74%
International: 40.34% |
| The New School |
TBA |
72.62% |
63.42% |
62.16% |
| Trinity College |
TBA |
29.00% |
29.25% |
33.52% |
| Trinity University |
TBA |
24.88% |
25.92% |
28.16% |
| Tufts University |
10.00% |
10.81% |
11.53% |
10.13% |
| Tulane University |
~15.00% |
14.46% |
13.98% |
14.59% |
| University at Albany |
TBA |
Overall: 70.44%
In-state: 70.07%
Out-of-state and international: 95.68% |
Overall: 69.09%
In-state: 68.48%
Out-of-state: 82.36%
International: 55.13% |
Overall: 69.87% |
| University at Buffalo |
TBA |
Overall: 80.59%
In-state: 80.09%
Out-of-state: 70.48%
International: 94.42% |
Overall: 74.18%
In-state: 76.16%
Out-of-state: 78.99%
International: 60.43% |
Overall: 69.30%
In-state: 68.08%
Out-of-state: 74.27%
International: 73.61% |
| University of California, Berkeley |
TBA |
Overall: 11.45%
In-state: 13.55%
Out-of-state: 10.33%
International: 5.80% |
Overall: 11.04%
In-state: 14.93%
Out-of-state: 7.34%
International: 3.38% |
Overall: 11.73%
In-state: 15.13%
Out-of-state: 7.80%
International: 3.53% |
| University of California, Davis |
TBA |
Overall: 44.35%
In-state: 37.14%
Out-of-state: 63.24%
International: 55.94% |
Overall: 41.83%
In-state: 36.55%
Out-of-state: 57.32%
International: 50.68% |
Overall: 41.64%
In-state: 36.25%
Out-of-state: 60.35%
International: 49.14% |
| University of California, Irvine |
TBA |
Overall: 28.70%
In-state: 21.88%
Out-of-state: 47.38%
International: 41.79% |
Overall: 28.78%
In-state: 21.82%
Out-of-state: 49.76%
International: 43.14% |
Overall: 25.75%
In-state: 20.39%
Out-of-state: 47.25%
International: 32.56% |
| University of California, Los Angeles |
TBA |
Overall: 9.41%
In-state: 9.61%
Out-of-state: 11.22%
International: 6.32% |
Overall: 8.97%
In-state: 9.53%
Out-of-state: 9.26%
International: 6.26% |
Overall: 8.73%
In-state: 9.46%
Out-of-state: 8.62%
International: 6.09% |
| University of California, Merced |
TBA |
Overall: 94.33%
In-state: 96.30%
Out-of-state: 83.88%
International: 79.97% |
Overall: 91.52%
In-state: 93.27%
Out-of-state: 85.02%
International: 85.03% |
Overall: 88.60%
In-state: 91.80%
Out-of-state: 75.97%
International: 61.56% |
| University of California, Riverside |
TBA |
Overall: 86.52%
In-state: 86.86%
Out-of-state: 88.84%
International: 82.09% |
Overall: 76.85%
In-state: 75.04%
Out-of-state: 91.03%
International: 84.99% |
Overall: 70.38%
In-state: 68.50%
Out-of-state: 85.23%
International: 78.65% |
| University of California, San Diego |
TBA |
Overall: 28.56%
In-state: 24.75%
Out-of-state: 39.66%
International: 30.91% |
Overall: 26.77%
In-state: 25.99%
Out-of-state: 33.49%
International: 22.44% |
Overall: 24.76%
In-state: 24.51%
Out-of-state: 31.92%
International: 17.93% |
| University of California, Santa Barbara |
TBA |
Overall: 38.20%
In-state: 32.12%
Out-of-state: 54.50%
International: 47.59% |
Overall: 32.96%
In-state: 32.38%
Out-of-state: 38.21%
International: 30.10% |
Overall: 27.78%
In-state: 28.05%
Out-of-state: 32.63%
International: 21.48% |
| University of California, Santa Cruz |
TBA |
Overall: 72.73%
In-state: 71.20%
Out-of-state: 84.12%
International: 72.40% |
Overall: 65.57%
In-state: 62.15%
Out-of-state: 81.41%
International: 77.06% |
Overall: 61.28%
In-state: 59.56%
Out-of-state: 80.14%
International: 58.85% |
| University of Central Florida |
TBA |
Overall: 42.80%
In-state: 47.39%
Out-of-state: 27.86%
International: 24.31% |
Overall: 44.71%
In-state: 49.12%
Out-of-state: 28.87%
International: 23.39% |
Overall: 43.39%
In-state: 48.21%
Out-of-state: 28.09%
International: 19.27% |
| University of Chicago |
TBA |
TBA |
4.48% |
4.79% |
| University of Colorado – Boulder |
TBA |
Overall: 70.67%
In-state: 81.31%
Out-of-state: 66.68%
International: 76.19% |
Overall: 76.21%
In-state: 84.84%
Out-of-state: 72.88%
International: 81.54% |
Overall: 81.43%
In-state: 92.29%
Out-of-state: 77.22%
International: 85.08% |
| University of Connecticut |
TBA |
Overall: ~54.00% |
Overall: 52.39% |
Overall: 53.95%
In-state: 44.94%
Out-of-state: 56.23%
International: 69.11% |
| University of Denver |
TBA |
85.38% |
77.29% |
71.19% |
| University of Florida |
TBA |
Overall: 19.77% |
Overall: 24.20%
In-state: 23.26%
Out-of-state: 23.82%
International: 32.49% |
Overall: 24.03%
In-state: 52.58%
Out-of-state: 14.25%
International: 19.60% |
| University of Georgia |
Overall: ~29.84% |
Overall: ~33.85% |
Overall: 37.92%
In-state: 46.98%
Out-of-state: 31.10%
International: 20.90% |
Overall: 37.19%
In-state: 50.24%
Out-of-state: 28.11%
International: 21.60% |
| University of Hawaii at Manoa |
TBA |
Overall: 87.97%
In-state: 88.71%
Out-of-state: 88.01%
International: 78.57% |
Overall: 86.60%
In-state: 87.34%
Out-of-state: 86.81%
International: 74.57% |
Overall: 69.67%
In-state: 80.69%
Out-of-state: 66.56%
International: 48.41% |
| University of Illinois, Urbana-Champaign |
TBA |
Overall: 36.59% In-state: 49.32% Out-of-state: 29.03% International: 30.49% |
Overall: 42.37%
In-state: 54.39%
Out-of-state: 36.20%
International: 33.52% |
Overall: 43.69%
In-state: 56.23%
Out-of-state: 35.87%
International: 34.50% |
| University of Maryland |
TBA |
Overall: 45.03%
In-state: 43.68%
Out-of-state and international: 45.55% |
Overall: 44.80%
In-state: 50.89%
Out-of-state and international: 42.54% |
Overall: 44.84%
In-state: 53.90%
Out-of-state and international:
41.56% |
| University of Massachusetts – Amherst |
TBA |
Overall: 59.89%
In-state: 57.79%
Out-of-state: 63.52%
International: 54.13% |
Overall: 59.73%
In-state: 60.47%
Out-of-state: 60.95%
International: 52.86% |
Overall: 57.77%
Out-of-state: 58.65%
In-state: 60.05%
International: 47.89% |
| University of Miami |
TBA |
17.61% |
18.90% |
18.51% |
| University of Michigan |
TBA |
16.42% |
15.64% |
17.94% |
| University of North Carolina at Chapel Hill |
TBA |
Overall: 16.72%
In-state: 34.84%
Out-of-state and international: 10.93% |
Overall: 15.34%
In-state: 37.99%
Out-of-state: 6.63%
International: 14.28% |
Overall: 18.74%
In-state: 41.16%
Out-of-state: 9.33%
International: 18.22% |
| University of North Carolina at Charlotte |
TBA |
Overall: 77.78%
In-state: 82.71%
Out-of-state: 66.85%
International: 70.00% |
Overall: 79.60%
In-state: 84.38%
Out-of-state: 67.38%
International: 73.95% |
Overall: 80.21%
In-state: 85.96%
Out-of-state: 65.45%
International: 66.92% |
| University of Notre Dame |
9.00% |
9.38% |
11.27% |
12.38% |
| University of Pennsylvania |
TBA |
4.92% |
5.40% |
5.87% |
| University of Pittsburgh |
TBA |
Overall: 59.45% |
Overall: 58.09% |
Overall: 49.70% |
| University of Rhode Island |
TBA |
TBA |
Overall: 72.16%
In-state: 74.58%
Out-of-state: 71.80%
International: 67.41% |
Overall: 77.07%
In-state: 75.89%
Out-of-state: 77.40%
International: 72.83% |
| University of Richmond |
TBA |
22.24% |
22.20% |
23.31% |
| University of Rochester |
TBA |
Overall: 41.91% |
Overall: 40.08%
College of Arts, Sciences and Engineering: 40.13%
Eastman School of Music: 39.00% |
Overall: 35.85%
College of Arts, Sciences and Engineering: 35.81%
Eastman School of Music: 36.89% |
| University of San Diego |
TBA |
53.58% |
52.38% |
46.81% |
| University of South Carolina |
TBA |
TBA |
Overall: 60.15%
In-state: 76.17%
Out-of-state: 54.72%
International: 65.32% |
Overall: 61.49%
In-state: 77.50%
Out-of-state: 55.60%
International: 62.02% |
| University of Southern California |
11.67% |
11.19% |
9.81% |
10.01% |
| University of Tennessee – Knoxville |
Overall: 47.81%
In-state: 76.00%
Out-of-state: 40.37%
International: 63.92% |
Overall: 43.58%
In-state: 72.83%
Out-of-state: 35.08%
International: 47.12% |
Overall: 41.60%
In-state: 70.10%
Out-of-state: 33.37%
International: 28.59% |
Overall: 45.99%
In-state: 60.40%
Out-of-state: 43.02%
International: 35.19% |
| University of Texas at Austin |
TBA |
Overall: 22.22% |
Overall: 26.64%
In-state: 37.72%
Out-of-state: 10.13%
International: 12.87% |
Overall: 29.12%
In-state: 40.97%
Out-of-state: 11.76%
International: 13.24% |
| University of Vermont |
TBA |
Overall: 73.04%
In-state: 76.54%
Out-of-state: 75.19%
International: 30.44% |
Overall: 65.30%
In-state: 74.15%
Out-of-state: 65.68%
International: 34.91% |
Overall: 60.02%
In-state: 71.43%
Out-of-state: 59.83%
International: 32.83% |
| University of Virginia |
In-state: 21.62%
Out-of-state and international: 9.61% |
In-state: 23.50%
Out-of-state: 12.91%
International: 11.62% |
In-state: 25.93%
Out-of-state: 13.83%
International: 10.46% |
In-state: 27.58%
Out-of-state: 13.18%
International: 11.50% |
| University of Washington – Seattle |
TBA |
Overall: 41.75%
In-state: 45.74%
Out-of-state: 42.16%
International: 35.64% |
Overall: 39.15%
In-state: 47.85%
Out-of-state: 36.20%
International: 38.83% |
Overall: 42.53%
In-state: 52.27%
Out-of-state: 38.46%
International: 45.42% |
| University of Wisconsin – Madison |
TBA |
Overall: 40.81%
In-state: 56.39%
Out-of-state: 40.33%
International: 31.60% |
Overall: 45.17%
In-state: 59.27%
Out-of-state: 45.55%
International: 33.26% |
Overall: 43.24%
In-state: 60.67%
Out-of-state: 42.67%
International: 31.91% |
| Vanderbilt University |
~4.08% |
5.33% |
5.86% |
6.28% |
| Vassar College |
TBA |
20.93% |
18.57% |
17.73% |
| Villanova University |
TBA |
27.53% |
26.98% |
25.12% |
| Virginia Tech |
TBA |
In-state: 47.33%
Out-of-state: 58.87%
International: 57.57% |
In-state: 47.65%
Out-of-state: 59.06%
International: 66.04% |
In-state: 47.08%
Out-of-state: 63.16%
International: 68.01% |
| Wake Forest University |
TBA |
20.76% |
21.67% |
21.56% |
| Washington and Lee University |
TBA |
13.39% |
13.97% |
17.36% |
| Washington University in St. Louis |
TBA |
11.92% |
12.06% |
11.96% |
| Wellesley College |
TBA |
14.79% |
14.05% |
13.91% |
| Wesleyan University |
15.78% |
16.11% |
16.49% |
17.10% |
| Willamette University |
TBA |
TBA |
77.09% |
79.08% |
| William & Mary |
Overall: 34.43% |
Overall: 36.96% |
Overall: 34.09%
In-state: 36.32%
Out-of-state and international: 34.43% |
Overall: 32.72%
In-state: 39.28%
Out-of-state and international: 28.19% |
| Williams College |
7.48% |
8.61% |
8.25% |
9.99% |
| Worcester Polytechnic Institute |
TBA |
61.89% |
60.16% |
58.50% |
| Yale University |
4.24% |
4.75% |
3.87% |
4.50% |
Note: “TBA” means the school has not yet released or confirmed the admit-rate data in this chart. Approximate rates are marked with “~.”
The college admissions landscape remains highly competitive for the Class of 2030.
As colleges continue releasing admissions data, early numbers show that many selective universities are maintaining historically low acceptance rates, while public universities continue to show major differences between in-state, out-of-state, and international applicants.
What Are Admit Rates?
A college’s admit rate, also called an acceptance rate, is the percentage of applicants who are offered admission.
For example, if a college receives 50,000 applications and admits 5,000 students, its admit rate is 10%.
However, admit rates do not tell the full story. Many colleges admit students through different rounds, including Early Decision, Early Action, Regular Decision, transfer admission, and special programs. Public universities may also have very different admit rates for in-state and out-of-state students.
Class of 2030 Admissions: Key Trends
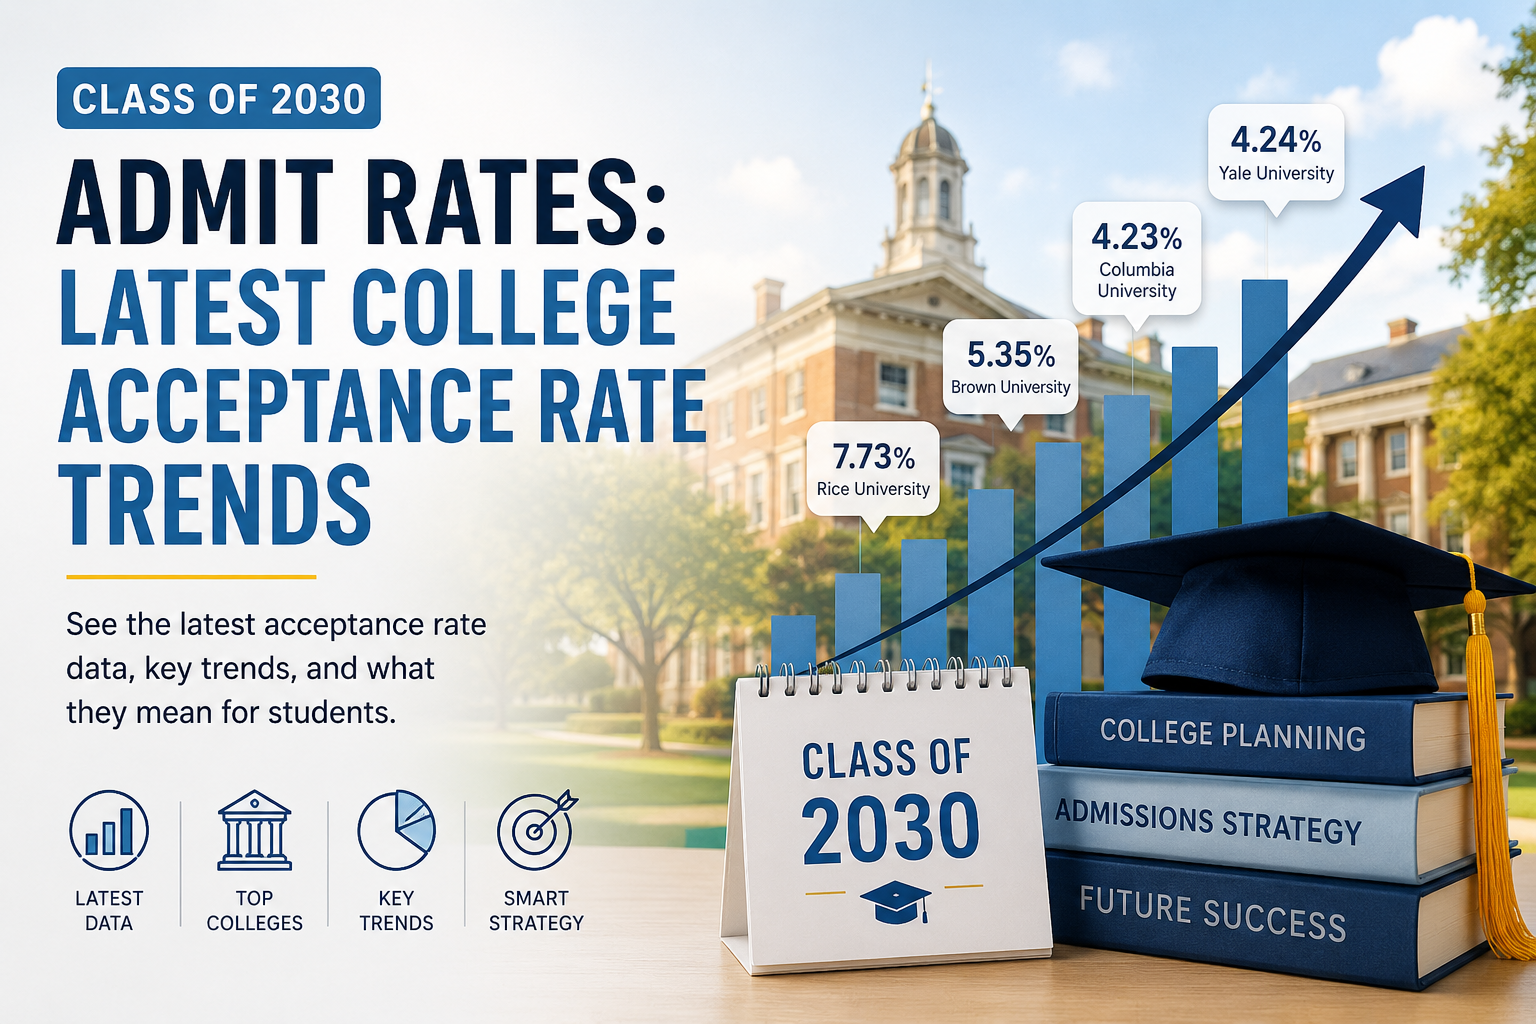
The Class of 2030 admissions cycle shows that competition at top colleges remains intense. Several highly selective schools reported admit rates below 10%, including Brown, Columbia, Dartmouth, Duke, MIT, Vanderbilt, Williams, Amherst, Bowdoin, and Yale.
Some schools became even more selective compared with the previous year. For example, Columbia’s admit rate decreased from 4.94% for the Class of 2029 to 4.23% for the Class of 2030. Duke also dropped from 5.20% to 4.73%, while Vanderbilt declined from 5.33% to approximately 4.08%.
At the same time, not every school followed the same pattern. Some universities remained relatively stable, while others became slightly less selective. This shows why students should avoid relying only on national headlines and instead look carefully at each college’s individual data.
Highly Selective Colleges Remain Extremely Competitive
Many of the most selective colleges continue to admit only a small percentage of applicants. Current Class of 2030 admit rates include:
| School |
Class of 2030 Admit Rate |
| Columbia University | 4.23% |
| Yale University | 4.24% |
| Massachusetts Institute of Technology | 4.58% |
| Duke University | 4.73% |
| Brown University | 5.35% |
| Dartmouth College | 5.84% |
| Bowdoin College | 6.53% |
| Amherst College | 6.78% |
| Williams College | 7.48% |
| Rice University | 7.73% |
| University of Notre Dame | 9.00% |
| Tufts University | 10.00% |
| University of Southern California | 11.67% |
| Boston College | 12.70% |
| Georgetown University | 13.00% |
These numbers make it clear that strong grades and test scores are only part of the admissions process. At highly selective schools, students also need strong essays, meaningful extracurricular involvement, academic focus, and a thoughtful college list.
Public University Admit Rates Can Vary by Residency
For many public universities, the overall acceptance rate does not tell the full story. In-state applicants often have a much higher admit rate than out-of-state or international applicants.
For example, Georgia Tech reported a Class of 2030 overall admit rate of 12.82%, but the in-state admit rate was approximately 27.64%, while the out-of-state and international admit rate was approximately 9.28%.
The University of Virginia also shows a major residency gap. For the Class of 2030, UVA reported:
| Applicant Type |
Class of 2030 Admit Rate |
| In-state | 21.62% |
| Out-of-state and international | 9.61% |
This matters because many families look at a school’s overall admit rate and assume it applies equally to all applicants. In reality, a student’s residency status can significantly affect admissions chances at public universities.
Colleges With Notable Class of 2030 Admit Rates
Below are several schools that have already released Class of 2030 admit-rate data:
| School |
Class of 2030 |
Class of 2029 |
Class of 2028 |
Class of 2027 |
| Amherst College | 6.78% | 7.72% | 9.01% | 9.81% |
| Boston College | 12.70% | 13.85% | 16.19% | 15.65% |
| Bowdoin College | 6.53% | 6.81% | 7.13% | 8.02% |
| Brown University | 5.35% | 5.65% | 5.39% | 5.23% |
| Columbia University | 4.23% | 4.94% | 3.86% | 4.00% |
| Dartmouth College | 5.84% | 6.02% | 5.40% | 6.23% |
| Duke University | 4.73% | 5.20% | 5.71% | 6.78% |
| Georgetown University | 13.00% | 13.49% | 12.91% | 13.08% |
| Georgia Tech | 12.82% | 13.34% | 14.07% | 16.46% |
| Lafayette College | 32.27% | 31.16% | 31.45% | 31.40% |
| MIT | 4.58% | 4.56% | 4.55% | 4.80% |
| Rice University | 7.73% | 8.01% | 8.00% | 7.88% |
| Swarthmore College | 7.44% | 7.52% | 7.46% | 6.94% |
| Tufts University | 10.00% | 10.81% | 11.53% | 10.13% |
| Tulane University | ~15.00% | 14.46% | 13.98% | 14.59% |
| University of Notre Dame | 9.00% | 9.38% | 11.27% | 12.38% |
| University of Southern California | 11.67% | 11.19% | 9.81% | 10.01% |
| Vanderbilt University | ~4.08% | 5.33% | 5.86% | 6.28% |
| Wesleyan University | 15.78% | 16.11% | 16.49% | 17.10% |
| William & Mary | 34.43% | 36.96% | 34.09% | 32.72% |
| Williams College | 7.48% | 8.61% | 8.25% | 9.99% |
| Yale University | 4.24% | 4.75% | 3.87% | 4.50% |
Why Admit Rates Are Getting Lower at Many Colleges
There are several reasons why admit rates have become lower at many selective colleges.
First, many schools have received larger applicant pools in recent years. Test-optional policies, increased national awareness, and easier application platforms have encouraged more students to apply to more colleges.
Second, students are building longer college lists. Instead of applying to 6 or 8 schools, many competitive applicants now apply to 12, 15, or even 20 colleges.
Third, colleges are carefully managing yield, which means they are trying to predict how many admitted students will actually enroll. This can lead to more waitlist activity and more strategic admissions decisions.
Finally, top colleges are not just looking for qualified students. They are building a balanced class. Academic excellence matters, but so do essays, recommendations, extracurricular depth, institutional priorities, geographic diversity, major interest, and personal background.
What This Means for Students
For students applying to college, the most important takeaway is that admit rates should guide strategy, not create panic.
A low admit rate does not mean a student should avoid applying. However, it does mean students need a balanced college list with reach, target, and likely schools.
Students should also avoid assuming that past admission trends will perfectly predict future outcomes. A school that admitted 15% of applicants last year may become more selective this year depending on application volume, institutional goals, and yield management.
The strongest applicants usually have three things in common:
- They build a smart, balanced college list.
- They present a clear academic and personal story.
- They start early enough to create thoughtful applications.
How to Use This Class of 2030 Admit Rate List
Students and families can use this list to understand how competitive each college has been over the past several years. When comparing schools, pay attention to:
- Whether the admit rate is overall or separated by residency
- Whether the rate includes Early Decision, Early Action, and Regular Decision
- Whether the school has a special college, campus, or program with separate admission standards
- Whether the school’s admit rate has been rising, falling, or staying stable
For public universities, students should be especially careful with residency-based numbers. An out-of-state applicant may face a very different level of competition than an in-state applicant.
Final Thoughts
The Class of 2030 admissions cycle confirms that college admissions remains highly competitive, especially at selective private universities and popular public flagships. While admit rates are useful, they should not be the only factor students consider when building a college list.
A thoughtful application strategy should include academic fit, major availability, financial affordability, campus culture, location, and realistic admissions chances.
As more colleges release Class of 2030 data, this article will continue to be updated with the latest admit rates and admissions trends.
Leave a Reply